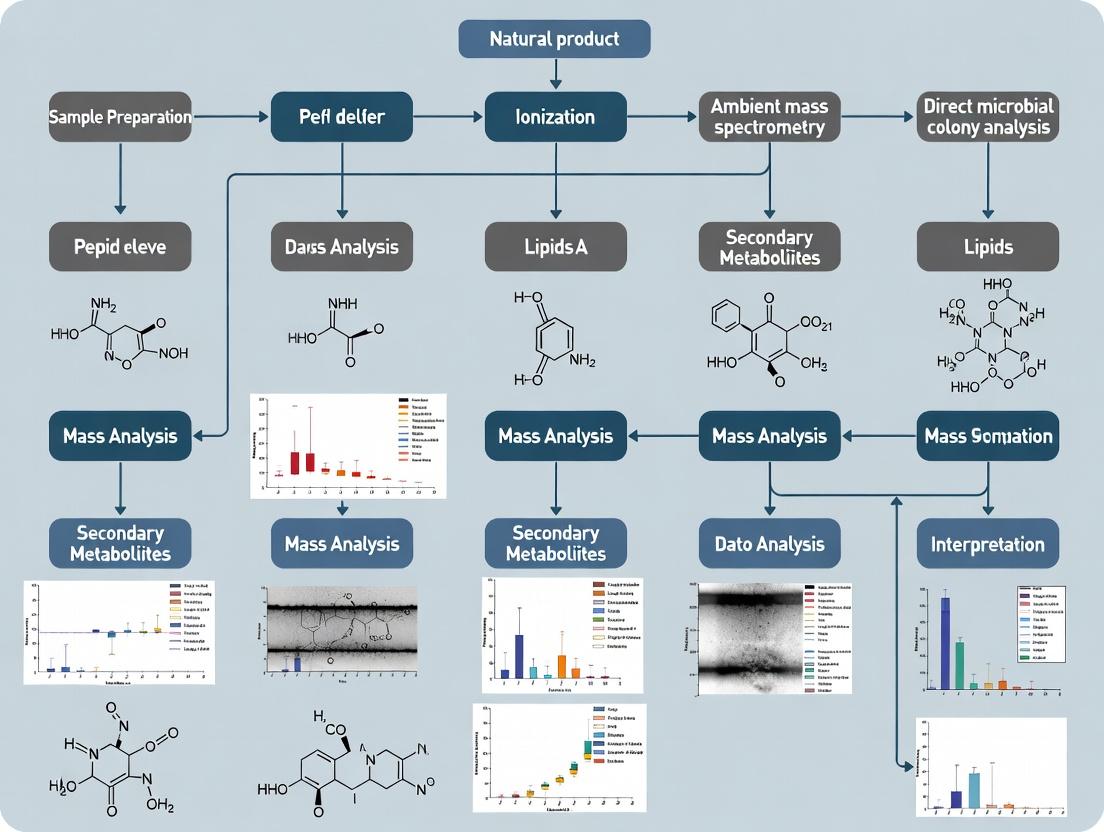
Direct from Colony: Ambient Mass Spectrometry Revolutionizes Rapid Microbial Identification for Research and Diagnostics
Ambient ionization mass spectrometry (AIMS) represents a paradigm shift in microbiological analysis by enabling the direct, real-time analysis of microbial colonies with minimal or no sample preparation.
Direct from Colony: Ambient Mass Spectrometry Revolutionizes Rapid Microbial Identification for Research and Diagnostics
Abstract
Ambient ionization mass spectrometry (AIMS) represents a paradigm shift in microbiological analysis by enabling the direct, real-time analysis of microbial colonies with minimal or no sample preparation. This article provides a comprehensive overview for researchers and drug development professionals, detailing the core principles of key techniques like DESI, DART, and Paper Spray. It explores practical methodologies for species- and strain-level discrimination, often enhanced by coupling with ion mobility separations and machine learning. A dedicated troubleshooting section addresses common challenges such as sensitivity issues and spectral interferences. Finally, the article validates AIMS against traditional and MALDI-TOF methods, evaluates commercial trends, and forecasts its transformative potential in accelerating clinical diagnostics, antimicrobial stewardship, and pharmaceutical research.
The Ambient MS Revolution: Core Principles and Techniques for Direct Microbial Analysis
Abstract Ambient Ionization Mass Spectrometry (AIMS) represents a transformative paradigm for analyzing biological samples in their native state with minimal pretreatment. This article details the application of AIMS for the direct analysis of microbial colonies, a core focus within broader research on microbial metabolomics and interspecies interactions. We provide definitive protocols for quantitative analysis and native protein characterization, supported by comparative performance data and specialized informatics workflows essential for deciphering complex chemotypic information.
The Ambient Ionization Framework for Native Microbial Analysis
Ambient Ionization Mass Spectrometry (AIMS) enables the direct desorption and ionization of analytes from samples in their native environment—at atmospheric pressure and with minimal to no preparation [1]. This capability is revolutionary for microbiology, as it allows for the real-time, in situ interrogation of microbial colonies, moving beyond destructive extraction and chromatography-based separation [2]. The core principle involves the separation of the ionization process from the mass spectrometer's vacuum system, allowing ionization to occur externally on untreated samples [1].
For microbial research, this paradigm facilitates two primary investigative streams: Imaging Mass Spectrometry (IMS) for spatial mapping of metabolites within and between colonies, and Real-Time Mass Spectrometry for dynamic monitoring of metabolic exchange [2]. The analysis targets specialized metabolites (e.g., antibiotics, siderophores, signaling molecules), lipids, and proteins that define microbial phenotype, communication, and pathogenicity. By preserving the native spatial and chemical context, AIMS directly links observed chemical distributions (chemotypes) to biological phenotypes, offering unprecedented insight into microbial community interactions and functions [3].
Core Ambient Ionization Techniques and Comparative Performance
Multiple AIMS techniques have been developed, each with unique mechanisms suited for different analytical challenges in microbial analysis. The choice of technique involves trade-offs between spatial resolution, analytical throughput, and molecular coverage [1].
Table 1: Key Ambient Ionization Techniques for Microbial Analysis
| Technique | Acronym | Ionization Mechanism | Typical Spatial Resolution | Key Microbial Application |
|---|---|---|---|---|
| Desorption Electrospray Ionization | DESI [1] | Charged solvent spray desorbs/ionizes analytes | 50 - 200 µm [1] | Direct colony profiling, lipidomics, imaging interspecies interaction zones [2] |
| Nanospray Desorption Electrospray Ionization | nano-DESI [1] | Liquid microjunction extracts analytes for nano-ESI | < 10 µm (probe limit) | High-sensitivity imaging of secreted metabolites from live colonies [2] |
| Laser Ablation Electrospray Ionization | LAESI [1] | Mid-IR laser ablation followed by ESI of particulates | 50 - 200 µm; single-cell possible [1] | Analysis of hydrated samples, plant-microbe interfaces, depth profiling [2] |
| Low-Temperature Plasma | LTP [1] | Reactive plasma species (e.g., He*, O2-, H3O+) desorb/ionize | 500 - 2000 µm | Rapid, non-contact screening of volatile/semi-volatile metabolites on colony surfaces [4] |
| Paper Spray Ionization | PSI | Solvent wicks through paper substrate containing sample to tip for ESI | N/A (bulk analysis) | Rapid extraction-less analysis of metabolites from colony scrapings or prints [5] |
Detailed Experimental Protocols
Protocol 1: Quantitative Analysis of Metabolites from Microbial Colonies Using Glass Capillary Sampling with Internal Standard [5] This protocol enables precise quantitation of targeted metabolites (e.g., a secreted antibiotic) directly from a colony or agar punch, addressing the reproducibility challenges in ambient sampling.
Capillary Coating with Internal Standard (IS):
- Prepare a methanol solution containing a known, low concentration (e.g., 100 ng/mL) of a stable isotope-labeled internal standard (IS) of the target analyte.
- Dip one end of a glass capillary (0.4 mm I.D., ~8 mm length) into the IS solution. The capillary will fill via capillary action to its total volume (V~C~ ≈ 1 µL).
- Hold the capillary vertically in air at 60°C for 5 minutes to evaporate the solvent, leaving a solid, uniform coating of IS on the inner wall [5].
Sample Collection and Transfer:
- Mount the coated capillary in a standard pipette tip holder for handling.
- Gently touch the open end of the capillary to the surface of a microbial colony or to a defined area of agar containing secreted metabolites. Allow the sample (a mix of cells and exudates) to fill the capillary via capillary action, ensuring the sample volume equals V~C~.
- Touch the capillary to a suitable substrate (e.g., chromatography paper for Paper Spray, a glass slide for DESI/LTP). The sample and the dissolved IS are transferred together, ensuring automatic and homogeneous mixing [5].
Ambient MS Analysis and Quantitation:
- Analyze the spotted substrate using the appropriate AIMS technique (e.g., Paper Spray MS, DESI, LTP).
- Use multiple reaction monitoring (MRM) on a triple quadrupole MS for high specificity. Monitor a fragment ion transition for both the native analyte and the co-spotted IS.
- Construct a calibration curve using the measured peak intensity ratio (Analyte/IS) versus the concentration ratio. The analyte concentration in the original sample (C~A~) is derived from the equation: I~A~/I~IS~ ∝ C~A~/C~IS~, where C~IS~ is the known concentration of the IS coating solution. This method yields precision with less than 5% RSD for sample volumes as low as 1 µL [5].
Protocol 2: Native Mass Spectrometry of Protein Complexes from Microbial Lysates Using Reduced-Pressure Ionization [6] This protocol details the analysis of intact protein complexes from microbial lysates under near-physiological conditions, enhanced by reduced-pressure ionization to tolerate non-volatile buffers.
Sample Preparation (Microbial Lysate):
- Harvest microbial cells and lyse them using a gentle method (e.g., osmotic shock, bead-beating in non-denaturing buffer).
- Clarify the lysate by centrifugation. Keep the supernatant in a native-friendly buffer (e.g., 100-200 mM ammonium acetate). For high-salt conditions mimicking cellular environments, NaCl up to 300 mM can be present [6].
Reduced-Pressure Ionization Chamber Setup:
- Interface a custom 3D-printed reduced-pressure chamber with the mass spectrometer's atmospheric inlet. The chamber should seal around the nanoESI emitter.
- Use the instrument's vacuum system or an auxiliary pump to reduce the chamber pressure to 200-750 mbar. Stable vacuum is achieved within seconds [6].
Native MS Data Acquisition:
- Load the clarified lysate or purified complex (e.g., 5 µM in native buffer) into a nanoscale or microscale emitter.
- Initiate the electrospray at the reduced pressure. The reduced pressure lowers the droplet size at formation, enhancing desolvation and significantly reducing non-volatile salt adducts.
- Acquire mass spectra on a high-mass-range instrument (e.g., Q-Exactive UHMR). Reduced-pressure ionization has been shown to improve signal-to-noise ratios by up to 20-fold for proteins in high-salt buffers and enables the detection of tight complexes at concentrations as low as 50 nM, which are often undetectable at ambient pressure [6].
Data Informatics and Molecular Workflow
The speed of AIMS generates complex, high-volume datasets. Specialized informatics are required to convert spectral data into biological insight [2].
Diagram 1: Informatics workflow for AIMS microbial data.
- Background Removal & Signal Enhancement: For imaging data, the Threshold Intensity Quantization (TrIQ) algorithm improves contrast by rescaling the dynamic range and limiting the impact of intensity outliers, facilitating clear region-of-interest (ROI) detection [4]. For time-series data, cross-correlation analysis of ion chronograms automatically identifies and removes background ions originating from the ambient environment, reducing spectral complexity by over 70% and grouping ions by their originating chemical species [7].
- Molecular Networking: Tandem MS (MS/MS) data from spots or ROIs is processed via molecular networking (e.g., on the GNPS platform). This clusters spectra based on similarity, visually mapping molecular families and facilitating the identification of known metabolites and the discovery of structural analogs within microbial interaction zones [2].
The Scientist's Toolkit: Essential Reagents and Materials
Table 2: Key Research Reagent Solutions for AIMS Microbial Analysis
| Item | Function/Description | Example Application/Note |
|---|---|---|
| Volatile Buffers (Ammonium Acetate, Ammonium Bicarbonate) | Maintains protein complex stability and native conformation during MS analysis without causing ion suppression [6]. | Essential for native MS of protein complexes from lysates. |
| Stable Isotope-Labeled Internal Standards (IS) | Enables precise relative quantitation by correcting for ionization variability and sample loss during ambient sampling [5]. | Used for targeted quantification of specific microbial metabolites (e.g., toxins, antibiotics). |
| Glass Capillaries (0.2-0.5 mm I.D.) | Provides a fixed, small-volume sampling device for reproducible collection and automated mixing with pre-coated IS [5]. | Core component of the quantitative sampling protocol for colonies. |
| Chromatography Paper (Grade 1) | Substrate for Paper Spray Ionization; wicks solvent to extract analytes from a dried sample spot for ESI [5]. | Used for rapid, analysis of colony scrapings. |
| Custom 3D-Printed Reduced-Pressure Chamber | Encloses the ESI emitter to lower local pressure, enhancing droplet desolvation and ion signal in the presence of non-volatile salts [6]. | Critical add-on for native MS analysis of samples in biological buffers. |
| Matrices for MALDI-IMS (e.g., DHB, CHCA) | Applied to colony surfaces to facilitate UV laser desorption/ionization for high-spatial-resolution imaging under vacuum conditions [2]. | Required for traditional MALDI-based imaging of microbial colonies (non-ambient). |
| Reference Strain Collections | Provides standardized, high-quality spectral fingerprints for building and validating microbe identification databases [2]. | Foundational for developing diagnostic AIMS workflows. |
Ambient Ionization Mass Spectrometry (AIMS) has fundamentally transformed the analytical workflow for direct sample analysis by enabling the interrogation of compounds in their native state, under atmospheric pressure, and with minimal sample preparation. Within the specific scope of a thesis focused on the direct analysis of microbial colonies, AIMS techniques offer an unparalleled capability to probe the chemical output of microorganisms in real-time and in situ. This research direction seeks to move beyond traditional, destructive methods to understand the dynamic production of specialized metabolites, virulence factors, and signaling molecules directly from the colony surface [2] [3]. Such direct analysis preserves spatial and temporal chemical information that is lost during extraction and chromatography, thereby providing a more authentic snapshot of microbial chemical ecology and physiology [3].
This article details the mechanistic underpinnings, experimental protocols, and application notes for three pivotal AIMS techniques: Desorption Electrospray Ionization (DESI), Direct Analysis in Real Time (DART), and Paper Spray Ionization. Each technique offers distinct pathways to liberate and ionize analytes from complex surfaces—such as an agar-grown microbial colony—and deliver them to the mass spectrometer. Mastery of these mechanisms is critical for tailoring analytical methods to specific research questions in microbial chemistry, whether the goal is spatial metabolite imaging, rapid strain differentiation, or monitoring metabolic exchange in real-time.
Desorption Electrospray Ionization (DESI)
DESI operates on a liquid-solid extraction and droplet pick-up mechanism [8]. A pneumatically assisted electrospray, typically composed of a charged solvent mixture (e.g., methanol/water), is directed at the sample surface [9]. Upon impact, the primary microdroplets wet the surface, forming a thin solvent film that dissolves (extracts) analytes. Subsequent collisions by incoming droplets generate secondary, analyte-laden microdroplets that are released from the surface. These secondary droplets undergo desolvation and Coulombic fission as they travel toward the mass spectrometer inlet, ultimately yielding gas-phase ions via mechanisms analogous to traditional electrospray ionization (ESI) [8]. The process is fundamentally a momentum-driven, liquid-phase microextraction event, making it highly effective for a broad range of polar and non-polar molecules, from lipids to secondary metabolites, directly from wet or dry surfaces [10].
Direct Analysis in Real Time (DART)
DART employs a gas-phase, Penning ionization mechanism [11]. An electrical discharge in a chamber containing flowing helium (or nitrogen) gas creates a plasma containing excited-state metastable atoms (He*). These metastable species are filtered to remove ions and electrons and then exit the source as a hot, neutral gas stream. When this stream interacts with atmospheric gases (e.g., N₂, H₂O) near the sample, Penning ionization occurs, producing reagent ions such as protonated water clusters [H₂O]ₙH⁺ [11]. These reagent ions then interact with analyte molecules desorbed from the surface by thermal assistance, leading to chemical ionization via proton transfer, electron transfer, or adduct formation [12]. The thermal desorption component is crucial, as the heated gas stream (up to 550°C) volatilizes analytes from the sample, making DART particularly suitable for low- to medium-molecular weight, thermally stable compounds [12].
Paper Spray Ionization
Paper Spray is an in-situ elution and electrospray mechanism performed directly on a porous substrate. A small, triangular piece of porous paper or other material holds the sample. Applying a small volume of solvent migrates through the paper via capillary action, eluting analytes from the sample spot. Simultaneously, a high voltage (3-5 kV) is applied directly to the paper substrate. When the solvent reaches the paper tip, the strong electric field induces the formation of a Taylor cone and a fine electrospray of charged droplets containing the analytes [2]. Ionization proceeds through standard ESI mechanisms. This technique integrates sample preparation (extraction), separation (via chromatographic effects on the paper), and ionization into a single step on a simple, disposable substrate, requiring only microliter volumes of solvent.
The fundamental operational and mechanistic differences between these techniques are summarized in Table 1.
Table 1: Comparative Overview of DESI, DART, and Paper Spray Mechanisms
| Feature | Desorption Electrospray Ionization (DESI) | Direct Analysis in Real Time (DART) | Paper Spray |
|---|---|---|---|
| Primary Ionization Mechanism | Droplet pick-up & liquid extraction followed by ESI [8] | Gas-phase Penning/chemical ionization [11] | In-situ elution & electrospray [2] |
| Energy Transfer Medium | Charged solvent droplets (momentum & dissolution) | Excited-state metastable gas & heat (thermal desorption) | Electric field & capillary solvent flow |
| Typelyzing Species | Protonated/deprotonated solvent clusters | Protonated water clusters, [M+H]⁺, [M-H]⁻, M⁺∙ | Protonated/deprotonated solvent molecules |
| Sample Introduction | Solid surfaces, tissues, liquids on surfaces | Solids, liquids, gases, surfaces | Dried samples on porous substrate |
| Key Operational Parameters | Solvent composition, spray angle/distance, gas pressure [10] | Gas temperature, grid voltage, sample distance [12] | Solvent composition, applied voltage, paper type |
| Suitable for Microbial Colony Analysis | Excellent for spatial imaging of metabolites [3] | Good for rapid, surface-level volatile/semi-volatile profiling | Good for targeted analysis of extracts or small colony sections |
DESI: Detailed Mechanism and Microbial Analysis Protocol
Detailed Ionization Mechanism
The DESI mechanism is a multi-step process best described as a "droplet pick-up" model [8]. A high-velocity stream of charged primary droplets (1-3 µm diameter) impacts the sample surface. The initial event is the formation of a thin liquid film on the surface, into which analytes dissolve. This is followed by a momentum transfer where subsequent primary droplets hit this wetted area, splashing and generating secondary microdroplets (typically < 1 µm) that contain the extracted analytes. These secondary droplets are then pneumatically propelled by the nebulizing gas flow toward the mass spectrometer inlet. During this transit, they evaporate and undergo Coulombic explosions, eventually releasing gas-phase ions via ion evaporation or charge residue mechanisms identical to conventional ESI [8]. This process is highly tolerant of salts and complex matrices, as the initial extraction acts as a natural clean-up step.
Experimental Protocol for Direct Microbial Colony Analysis
Research Aim: To perform a spatially-resolved analysis of specialized metabolites directly from a microbial colony grown on agar.
Sample Preparation:
- Culture the microorganism of interest on a suitable agar medium in a standard Petri dish until well-grown colonies are formed.
- Prior to analysis, briefly dry the agar plate in a laminar flow hood for 2-5 minutes to remove excess surface moisture, which can suppress ionization. Do not desiccate the colony.
Instrument Setup (DESI Source):
- Solvent: Prepare a spray solvent of methanol:water (95:5, v/v) with 0.1% formic acid for positive ion mode. For negative ion mode, use methanol:water with 0.1% ammonium hydroxide. Deliver at a flow rate of 1.5-3 µL/min [10].
- Nebulizing Gas: Use high-purity nitrogen gas at a pressure of 120-180 psi.
- Geometry: Optimize the sprayer-to-surface distance (
d1) to ~2 mm and the sprayer-to-inlet distance (d2) to ~5 mm. The incident angle (α) is typically set between 50-60° [10] [8]. - Mass Spectrometer: Operate the mass spectrometer in full-scan mode over an appropriate m/z range (e.g., 100-2000). High-resolution mass spectrometry (e.g., Q-TOF, Orbitrap) is recommended for metabolite identification.
Analysis Procedure:
- Secure the opened Petri dish on the DESI movable stage.
- Define the imaging area to encompass the colony and surrounding agar.
- Set the spatial resolution (raster step size); 50-200 µm is typical for colony imaging.
- Initiate the automated imaging run. The stage will move the sample relative to the fixed DESI spray and inlet, collecting a mass spectrum at each pixel.
Data Analysis:
- Use imaging software (e.g., SCiLS Lab, HDImaging) to reconstruct ion images for specific m/z values.
- Overlay ion images of key metabolites (e.g., antibiotics, siderophores) to visualize their spatial distribution across the colony and agar [3].
- Perform principal component analysis (PCA) on the spectral dataset to highlight chemical differences between colony regions (center vs. edge) or between different microbial strains.
Diagram: DESI Droplet Pick-up Ionization Workflow
DART: Detailed Mechanism and Microbial Analysis Protocol
Detailed Ionization Mechanism
DART ionization is initiated by the generation of long-lived excited-state species [11]. Inside the source, a glow discharge in helium gas creates a plasma containing ions, electrons, and excited atoms (He). Electrostatic lenses remove charged particles, allowing only neutral, metastable helium atoms (He) to exit in a heated stream. These metastables, possessing high internal energy (~19.8 eV for He), cannot ionize helium itself but can ionize atmospheric molecules through Penning ionization: He + M → He + M⁺• + e⁻, where M is typically N₂ or H₂O [11]. This creates a cascade of reactions forming protonated water clusters [H₂O]ₙH⁺, which serve as the primary reagent ions. Analytes (S) are thermally desorbed from the sample surface by the heated gas stream and are subsequently ionized in the gas phase via proton transfer: [H₂O]ₙH⁺ + S → [S+H]⁺ + nH₂O. In negative ion mode, electrons from the plasma can initiate reactions leading to deprotonation or electron capture [11].
Experimental Protocol for Rapid Microbial Profiling
Research Aim: To acquire rapid chemical fingerprints from intact microbial colonies for differentiation or screening.
Sample Preparation (Swab Method):
- Using a sterile nylon or cotton swab, gently collect biomass from the surface of a microbial colony.
- For a more controlled analysis, use a 12-DipIt sampler or a similar mesh holder. Gently touch the sampler to the colony surface to transfer a tiny amount of cells [13].
- Immediately present the swab tip or sampler to the DART gas stream.
Instrument Setup (DART Source):
- Carrier Gas: Use high-purity helium (grade 5.0 or higher). Set the gas flow rate according to manufacturer specifications.
- Gas Temperature: Optimize between 250°C and 450°C. Start at 350°C; lower temperatures for volatile compounds, higher for less volatile metabolites [12].
- Grid Electrode Voltages: Set the exit grid voltage appropriately for positive (+100 to +250 V) or negative ion mode (-100 to -250 V) [11].
- Mass Spectrometer: Operate in fast-scanning mode (e.g., TOF-MS). Calibrate the instrument before analysis, for example, using a polyethylene glycol standard via the swab [13].
Analysis Procedure:
- Hold the swab or sampler in a movable stage or manually at a fixed distance (~5-20 mm) from the DART source exit and the MS inlet.
- Initiate data acquisition.
- Move the sample slowly through the ionizing gas stream for 10-30 seconds to ensure a stable signal is recorded.
- For high-throughput, use an autosampler (e.g., a linear rail system) to analyze multiple swabs or mesh holders sequentially [13].
Data Analysis:
- Average the mass spectrum across the stable signal period.
- Generate a chemical fingerprint based on the presence of characteristic lipid (e.g., phospholipids) or small metabolite ions.
- Use statistical tools like PCA or hierarchical clustering to differentiate between species or strains based on their spectral fingerprints.
- Compare unknown spectra against an in-house library of reference microbial strain spectra.
Diagram: DART Gas-Phase Ionization Pathway
Paper Spray: Detailed Mechanism and Microbial Analysis Protocol
Detailed Ionization Mechanism
In Paper Spray, the substrate is integral to the mechanism. Upon application of solvent, capillary action draws the liquid through the porous, hydrophilic matrix of the paper triangle. As the solvent front moves, it elutes and concentrates analytes from the dried sample spot, offering a rudimentary chromatographic separation effect based on analyte affinity for the paper (cellulose) versus the mobile phase. When the solvent reaches the sharp tip of the paper triangle, the application of high voltage (typically +3 to +5 kV for positive mode) to the paper induces a strong electric field at the liquid apex. This causes the formation of a Taylor cone and the emission of a fine plume of charged droplets, essentially creating an electrospray directly from the paper substrate [2]. Ionization then follows standard ESI mechanisms (ion evaporation or charge residue model). The entire process combines solid-phase extraction, micro-volume elution, and ionization in one device.
Experimental Protocol for Targeted Analysis of Microbial Extracts
Research Aim: To perform rapid, low-volume analysis of a metabolite extract from a microbial colony.
Sample Preparation:
- Option A (Direct Analysis): Carefully cut a small section (1-2 mm²) of an agar-grown microbial colony using a sterile tool and place it directly onto the center of a pre-cut triangular paper substrate.
- Option B (Extract Analysis): Extract metabolites from a colony using 10-20 µL of a suitable solvent (e.g., 80% methanol). Spot 1-2 µL of this extract onto the center of the paper triangle and allow it to dry.
Instrument Setup:
- Paper Substrate: Use commercially available chromatography paper or defined porous materials cut into equilateral triangles (~10 mm sides). Position the triangle so the sample spot is near the base and the apex points toward the MS inlet.
- Solvent: Apply 10-20 µL of spray solvent (e.g., methanol with 0.1% formic acid) to the sample spot/base of the paper. The solvent volume must be sufficient to reach the tip but not flood it.
- High Voltage: Connect a high-voltage power supply lead directly to the paper triangle using an alligator clip or a conductive holder. Apply +3.5 to 4.5 kV for positive ion mode.
- Mass Spectrometer: Position the paper tip 3-10 mm from the MS inlet. Operate the MS in targeted (SRM/MRM) or full-scan mode.
Analysis Procedure:
- Apply the high voltage.
- Immediately apply the spray solvent to the paper. Ion emission should begin within seconds as the solvent wicks to the tip.
- Acquire mass spectrometric data for 0.5-2 minutes, as long as a stable spray is maintained.
- After analysis, discard the paper triangle.
Data Analysis:
- The signal is often transient. Average the spectrum across the period of stable total ion current.
- For targeted analysis, identify compounds based on exact mass and/or characteristic fragmentation patterns from tandem MS experiments.
- Quantification can be achieved by incorporating an internal standard into the spray solvent and comparing ion abundance ratios.
The Scientist's Toolkit: Essential Research Reagent Solutions
Selecting the appropriate materials is critical for successful and reproducible AIMS experiments in microbial research. Table 2 details essential reagents and consumables.
Table 2: Key Research Reagent Solutions for AIMS of Microbial Colonies
| Item | Primary Function | Technical Notes & Rationale |
|---|---|---|
| High-Purity Solvents (MS Grade) | Forming the electrospray (DESI, Paper Spray) or extracting analytes. | Methanol, acetonitrile, water, with additives (0.1% formic acid, ammonium acetate). Low volatility and appropriate pH modifiers are crucial for efficient ionization and analyte solubility [10] [8]. |
| High-Purity Gases | Nebulizing gas (DESI) and metastable carrier gas (DART). | Nitrogen (N₂) for DESI nebulization; Helium (He, 99.999%+) for DART. Gas purity directly impacts background noise and ionization stability [12] [11]. |
| Porous Substrates | Sample support for Paper Spray. | Chromatography paper (Whatman Grade 1), glass microfiber, or polymer-based substrates. Pore size and uniformity affect solvent wicking, elution efficiency, and spray stability. |
| Specialized Samplers | Standardized sample introduction for DART/DESI. | 12-DipIt samplers, mesh holders, or linear rail autosamplers. Enable reproducible positioning and high-throughput analysis of swabs or sample-loaded meshes [13]. |
| Volumetric Air Sampler & Growth Media | Environmental monitoring and colony cultivation for subsequent AIMS analysis. | For comprehensive studies (e.g., pharmaceutical contamination), active air sampling onto Tryptic Soy Agar (TSA) or Reasoner’s 2A Agar (R2A) is used to capture environmental microbes before AIMS identification [14]. |
| Reference Standards & Calibrants | Mass axis calibration and method development. | Tune mixtures (e.g., FC-43 for DART TOF-MS [13]), deuterated internal standards for quantification, and pure metabolite standards for mechanism validation. |
The direct analysis of microbial colonies represents a paradigm shift in clinical microbiology and diagnostic science. Within the broader thesis on ambient mass spectrometry for direct microbial colony analysis, the concept of the microbial chemotype emerges as a critical framework. A chemotype is defined as the unique biochemical fingerprint of an organism, comprising its complement of lipids, metabolites, and proteins [15]. This profile is not merely a static identifier but a dynamic reflection of microbial physiology, virulence, and antimicrobial resistance [16].
Traditional identification methods, while foundational, are often slow and lack the granularity to distinguish closely related strains or assess functional characteristics like pathogenicity and drug susceptibility [17]. Ambient mass spectrometry techniques, which allow for the analysis of samples in their native state with minimal preparation, are uniquely positioned to decode these chemotypes directly from a colony [15]. By integrating these molecular fingerprints with advanced data analytics, this research aims to establish a rapid, high-throughput platform for precise microbial diagnosis, moving beyond identification to functional characterization. This approach aligns with the growing demand for tools that support precision medicine, offering actionable diagnostic information that can guide therapeutic decisions [18].
Foundational Concepts and Quantitative Performance
The diagnostic power of microbial chemotyping lies in the distinct classes of biomolecules that constitute the fingerprint. Each class provides complementary information, and the choice of analytical technique determines which layer of the chemotype is revealed.
Table 1: Core Components of the Microbial Chemotype and Their Diagnostic Significance
| Biomolecule Class | Representative Examples | Diagnostic & Functional Significance | Primary Analytical Technique (Direct Analysis) |
|---|---|---|---|
| Proteins & Peptides | Ribosomal proteins, virulence factors, enzymes [17] | Species/strain identification, phylogenetic typing, detection of toxin production [16] | MALDI-TOF MS, Top-Down Proteomics [16] |
| Lipids & Fatty Acids | Phospholipids (e.g., cardiolipin), glycolipids, mycolic acids [15] | Membrane structure characterization, detection of stress responses, differentiation of Gram-status [15] | DESI-MS, Pyrolysis-GC-MS [15] |
| Primary & Specialized Metabolites | Organic acids, quorum-sensing molecules (e.g., acyl-homoserine lactones), antibiotics, siderophores [15] | Insight into metabolic activity, virulence communication, antimicrobial resistance mechanisms, niche adaptation [15] | LC-MS/MS, Imaging MS, DESI-MS [15] |
Different mass spectrometry platforms offer varying windows into the chemotype, with trade-offs between speed, depth of analysis, and discriminatory power.
Table 2: Comparison of Mass Spectrometry Platforms for Microbial Chemotype Analysis
| Technique | Typical Analysis Time per Sample | Effective Mass Range | Key Strength | Primary Limitation | Best for Chemotype Component |
|---|---|---|---|---|---|
| MALDI-TOF MS (Routine ID) | 1-5 minutes [17] | 2,000 - 20,000 m/z [17] | Extremely fast, high-throughput, excellent for species-level ID from protein profiles [17] [16] | Limited depth; poor at strain typing, resistance detection, or metabolite analysis [16] | Proteins/Peptides |
| LC-ESI-MS/MS (Bottom-Up Proteomics) | 60-120 minutes | Full proteome | Deep, comprehensive proteome coverage; can identify thousands of proteins and modifications [16] [18] | Lengthy sample preparation (extraction, digestion); not "ambient" or direct | Proteins/Peptides |
| Ambient Ionization MS (e.g., DESI) | 3-10 minutes | < 2,000 m/z | Minimal sample prep; direct analysis of colonies; sensitive to lipids and small molecules [15] | Lower spectral complexity than MALDI for proteins; requires optimization for different targets [15] | Lipids, Metabolites |
| High-Resolution MS (e.g., Orbitrap) | Variable (5-60 min) | Full range | Exceptional mass accuracy and resolution; enables unambiguous identification of metabolites and proteoforms [18] | Costly instrumentation; complex data analysis; often not the fastest option | All Components |
Detailed Application Notes & Protocols
Application Note 001: Rapid Species Identification and Strain Typing via MALDI-TOF MS Protein Profiling
- Objective: To reliably identify microbial species to the strain level using direct colony protein profiling.
- Background: Standard MALDI-TOF MS databases excel at species-level identification but often fail to differentiate epidemiologically distinct strains (e.g., outbreak vs. commensal strains) [16]. Advanced analysis of protein peak patterns can uncover these subtler differences.
- Procedure:
- Sample Preparation: Using a sterile loop, transfer a single microbial colony from a fresh culture plate (18-24 hours old) onto a dedicated spot on a MALDI target plate.
- Matrix Application: Immediately overlay the sample with 1 µL of matrix solution (e.g., α-cyano-4-hydroxycinnamic acid (HCCA) for most bacteria, dissolved in 50% acetonitrile/2.5% trifluoroacetic acid). Allow to dry completely at room temperature [17].
- Instrumental Analysis: Acquire mass spectra in linear positive ion mode across a mass range of 2,000-20,000 m/z. Each spectrum should be an average of 200-500 laser shots from different positions of the sample spot [17].
- Data Processing & Advanced Analysis: Compare the raw spectrum against a commercial reference database (e.g., Bruker MBT, Vitek MS) for initial species ID. For strain typing, export the peak list (m/z and intensity) and analyze using bioinformatics tools. Perform hierarchical clustering or principal component analysis (PCA) on peak data from multiple isolates to visualize strain-related groupings [16].
- Expected Outcomes: A standard log(score) > 2.0 indicates reliable species identification [17]. Strain-level discrimination is achieved when isolates cluster separately in PCA plots based on specific biomarker peaks (e.g., presence/absence of a peak at a specific m/z indicative of a ribosomal protein variant).
Application Note 002: Detection of Antimicrobial Resistance (AMR) Signatures via Metabolomic Profiling
- Objective: To detect phenotypic resistance to antibiotics by monitoring changes in microbial metabolite profiles.
- Background: Resistance mechanisms (e.g., enzyme production, efflux pump activity) alter the bacterium's metabolic state. Ambient MS can detect the depletion of a drug or the accumulation of resistance-associated metabolites directly from a colony [15].
- Procedure:
- Conditioned Colony Growth: Prepare two sets of inoculum from the test isolate. Spot onto agar plates: A) Drug-free control plate. B) Plate containing a sub-inhibitory concentration of the target antibiotic.
- Sample Harvesting: After 16-24 hours of growth, harvest biomass from both conditions using a moistened sterile tip.
- Direct Analysis via DESI-MS: Apply the biomass directly to a glass slide or PTFE membrane. Analyze immediately using a DESI source coupled to a high-resolution mass spectrometer (e.g., Orbitrap). Acquire data in negative ion mode (50-1000 m/z) to capture a wide range of lipids and metabolites [15].
- Targeted Data Interrogation: Process the data to look for: a) The molecular ion of the antibiotic itself (diminished in resistant strains due to modification or degradation). b) Characteristic fragment ions or adducts of modified antibiotic products. c) Significant changes in endogenous metabolite peaks (e.g., stress-related lipids or nucleotides) between the control and drug-exposed samples.
- Expected Outcomes: A susceptible strain will show a strong signal for the intact antibiotic and a metabolic profile indicative of stress or cell death. A resistant strain may show a transformed antibiotic product, a lack of metabolic shift, or a signature consistent with active efflux or bypass metabolism.
Application Note 003: Spatial Mapping of Microbial Community Interactions via Mass Spectrometry Imaging (MSI)
- Objective: To visualize the chemical dialogue between different species in a polymicrobial colony or biofilm.
- Background: Microbes in communities interact chemically through secreted metabolites. Understanding this "chemical ecology" is key to deciphering biofilm resilience and pathogen synergies [15] [19].
- Procedure:
- Model Community Preparation: Co-culture two or more microbial species on a porous membrane placed on an agar surface. Allow a structured colony or micro-colony biofilm to form (24-72 hours).
- Sample Sectioning: Snap-freeze the entire membrane and biomass in liquid nitrogen. Cryo-section the sample (5-20 µm thickness) and thaw-mount onto a conductive glass slide or indium tin oxide (ITO) slide.
- MALDI Matrix Application for Imaging: Apply a homogeneous layer of matrix (e.g., 2,5-dihydroxybenzoic acid (DHB) for metabolites/lipids) using a robotic sprayer.
- MALDI-MSI Acquisition: Raster the laser across the sample section in 20-50 µm steps. At each pixel, acquire a full mass spectrum.
- Data Visualization & Analysis: Reconstruct ion images for the m/z values of interest (e.g., a siderophore from Species A, a quorum-sensing molecule from Species B, a communal biofilm lipid). Overlay these images to visualize spatial correlations and chemical gradients [15].
- Expected Outcomes: Ion images will reveal if specific metabolites are produced only at the interface between species, localized to one species' zone, or diffusely spread. This provides direct evidence of metabolic cross-feeding, antagonism, or co-regulation.
Experimental Workflow and Pathway Visualization
Diagram 1: From Colony to Diagnosis: The Ambient MS Chemotyping Pipeline (94 characters)
Diagram 2: Instrumental Workflow for Ambient MS Chemotype Analysis (86 characters)
The Scientist's Toolkit: Essential Research Reagents & Materials
Table 3: Key Reagents and Materials for Ambient MS Microbial Chemotyping
| Item Name | Specification / Example | Primary Function in Protocol |
|---|---|---|
| MALDI Matrix | α-cyano-4-hydroxycinnamic acid (HCCA), 2,5-dihydroxybenzoic acid (DHB), Sinapinic Acid (SA) [17] | Absorbs laser energy, facilitates soft ionization and co-crystallization with the analyte for MALDI-based analysis [17]. |
| ES/DESI Spray Solvent | Methanol/Water or Acetonitrile/Water mixtures (e.g., 90:10 v/v) with 0.1% formic acid or ammonium acetate [15] | Serves as the ionization medium in electrospray-based ambient techniques; choice affects metabolite/lipid extraction efficiency and ion polarity. |
| Conductive Target Plates | Stainless steel or coated glass (e.g., ITO) MALDI target plates | Provides a conductive surface for sample application and effective charge neutralization during MALDI analysis. |
| Chromatography Media (Optional) | C18-coated porous surfaces or PTFE membranes | Used in some ambient setups (like paper spray) to provide a substrate for sample application and preliminary clean-up/separation. |
| Internal Standard Mix | Stable isotope-labeled lipids, amino acids, or metabolites (e.g., 13C, 15N) [18] | Added to samples to enable precise relative quantification (via isotope dilution) and correct for ionization variability [18]. |
| Quality Control Strain | Certified reference microbial strain (e.g., E. coli ATCC 8739) | Run daily to calibrate the instrument, validate protocol performance, and ensure spectral reproducibility. |
| Data Analysis Software | Commercial (e.g., Bruker flexAnalysis, Thermo Compound Discoverer) and Open-Source (e.g., MS-DIAL, METLIN) [15] | Essential for processing raw spectra: peak picking, alignment, background subtraction, and database searching for metabolite/protein identification. |
The rapid and accurate identification of microorganisms is a cornerstone of modern microbiology, with profound implications for clinical diagnostics, antimicrobial stewardship, and public health. Conventional methods, including culture-based techniques, biochemical testing, and even molecular methods like PCR, often involve lengthy processes ranging from 24 hours to several days [20]. This time lag delays critical decisions, contributing to the misuse of broad-spectrum antibiotics and the escalation of antimicrobial resistance—a crisis that directly caused 1.2 million global deaths in 2019 and threatens millions more [20].
Ambient Mass Spectrometry (AMS) represents a revolutionary alternative. By enabling the direct analysis of microbial colonies in their native state with minimal sample preparation, AMS techniques collapse diagnostic timelines from days to minutes [20]. This Application Note details the practical implementation of ambient ionization MS, specifically Paper Spray Ionization (PSI) coupled with Ion Mobility Spectrometry (IMS), within a research framework focused on direct microbial colony analysis. We provide validated protocols, performance data, and a detailed toolkit to empower researchers in implementing this transformative technology.
Application Notes: Performance Data & Comparative Analysis
The integration of ambient ionization with IMS-MS generates multi-dimensional data (m/z, collision cross-section, and fragmentation patterns) that enables high-fidelity microbial discrimination. The following tables summarize key quantitative performance metrics from recent studies.
Table 1: Performance Metrics for Ambient Ionization MS in Microbial ID
| Microbial Target | Technique | Sample Prep Time | Analysis Time | Key Performance Metric | Reference |
|---|---|---|---|---|---|
| 6 Gram-positive bacterial species | Paper Spray (PS)-MS | <1 min (direct from colony) | ~1 min per sample | 98% prediction rate (negative ion mode) | [20] |
| 10 Gram-negative bacterial species | PS-MS with data fusion | <1 min (direct from colony) | ~1 min per sample | 87% prediction rate (positive + negative ions) | [20] |
| 8 Candida fungal species | PS-MS with lysis solvent | ~2 min (on-paper lysis) | ~1 min per sample | 90% prediction rate | [20] |
| 7 E. coli strains | PS-IM-MS/MS (Lipidomics) | <1 min (direct from colony) | ~3 min per sample | 100% discrimination via PL & FA CCS values | [20] |
| E. coli in artificial urine | PS-IM-MS with Machine Learning | 4-hour culture + minimal prep | ~1 min per sample | Species ID and strain-level typing achieved | [20] |
Table 2: Comparative Analysis: Traditional vs. Ambient MS Workflows
| Parameter | Traditional Culture & Biochemical ID | MALDI-TOF MS (Current Standard) | Ambient Ionization IM-MS (Featured) |
|---|---|---|---|
| Total Time to ID | 24 – 72 hours | ~30 minutes – 24 hours | < 5 minutes (post-culture) |
| Primary Culture Required | Yes, 18-48 hours | Yes, often 18-24 hours | Reduced to 4 hours possible [20] |
| Sample Preparation | Extensive: subculture, staining, tests | Requires matrix application, spot drying | Minimal or none: direct colony sampling |
| Chemical Specificity | Low (phenotypic) | High (protein profiles) | Very High: lipids, metabolites, CCS values |
| Strain-Level Discrimination | Possible with additional tests | Limited, requires specialized databases | High potential via lipid isomers & CCS [20] |
| Throughput Potential | Low | High (automated) | High to Very High (rapid sampling) |
| Platform Flexibility | Low | Dedicated benchtop system | High: Couples with portable MS systems. |
Detailed Experimental Protocols
Protocol 1: Rapid Species-Level ID using Paper Spray Ionization MS
This protocol is adapted for the direct analysis of bacterial colonies from solid agar media [20].
I. Materials & Preparation:
- Triangular Paper Substrates: Cut chromatography paper (Whatman Grade 1) into right isosceles triangles (approx. 10 mm legs).
- Spray Solvent: Methanol:Water (95:5, v/v) with 0.1% formic acid for positive ion mode; Ammonium hydroxide (0.1%) in methanol for negative ion mode.
- Mass Spectrometer: Coupled with a custom PS ion source or commercial interface.
- Solid Agar Culture: Pure microbial colonies grown for 4-24 hours.
II. Procedure:
- Colony Sampling: Lightly touch the apex of a clean paper triangle to a single microbial colony. A barely visible transfer of material is sufficient.
- Source Placement: Secure the paper triangle to a holder/clip, positioning the tip 3-5 mm from and in-line with the MS inlet.
- Solvent Application: Apply 20-30 µL of the appropriate spray solvent to the center of the paper triangle.
- Voltage Application & Data Acquisition: Immediately apply a high voltage (+3.5 to +4.5 kV for positive mode / -2.5 to -3.5 kV for negative mode) to the paper holder. Initiate MS acquisition for 30-60 seconds. Spectral profiles are typically stable within 15 seconds.
- Data Processing: Average the spectra over the stable signal period. Process using multivariate statistical tools (e.g., Principal Component Analysis - PCA, Linear Discriminant Analysis - LDA) against a validated spectral library.
Protocol 2: Strain-Level Discrimination via PS-Ion Mobility-MS/MS
This protocol enhances specificity by integrating IMS and MS/MS for phospholipid profiling [20].
I. Materials & Preparation:
- Materials from Protocol 1.
- IMS-MS System: A mass spectrometer equipped with a traveling wave or drift tube ion mobility cell.
- Data Processing Software: Capable of extracting collision cross-section (CCS) values and performing tandem MS.
II. Procedure:
- Sample Introduction: Follow Steps 1-3 of Protocol 1.
- IM-MS Acquisition: Operate the MS in negative ion mode for optimal lipid detection. Acquire data with IMS separation enabled. Key phospholipid ions (e.g., phosphatidylglycerols (PGs), phosphatidylethanolamines (PEs)) will be separated in the ion mobility dimension.
- CCS Calibration & Extraction: Use a calibrant (e.g., polyalanine) to establish the CCS calibration curve. Extract the drift time and calibrated CCS values for major lipid ions (e.g., m/z 747.5, PG(32:1)).
- MS/MS Verification: Isolate target precursor ions from the IMS-separated peak and perform collision-induced dissociation (CID). Confirm lipid identities based on characteristic fatty acid fragment ions.
- Discriminatory Analysis: Construct a model using both m/z and CCS values as orthogonal identifiers. Closely related strains (e.g., different E. coli K-12 derivatives) often show distinct CCS values for isomeric lipids, enabling 100% discrimination in controlled studies [20].
Visualizations: Workflows and Molecular Pathways
Title: Ambient Ionization MS Workflow for Microbial ID vs. Traditional Path
Title: Molecular Pathway for Microbial Discrimination via AMS-IM-MS
The Scientist's Toolkit: Essential Research Reagents & Materials
Table 3: Key Reagent Solutions for Ambient MS Microbial Analysis
| Item | Typical Formulation/Example | Primary Function in Analysis | Critical Notes |
|---|---|---|---|
| Spray Solvent (Positive Ion Mode) | Methanol/Water (95:5) + 0.1% Formic Acid | Extracts lipids/metabolites; promotes protonation [H]⁺ for MS detection. | Formic acid enhances ionization efficiency of basic and polar molecules [20]. |
| Spray Solvent (Negative Ion Mode) | Methanol + 0.1% Ammonium Hydroxide | Extracts analytes; promotes deprotonation [H]⁻ for optimal lipid detection. | Essential for analyzing phospholipids and fatty acids [20]. |
| Lysis/Solubilization Solvent | N,N-Dimethylformamide (DMF) or Chloroform:MeOH mix | Disrupts tough cell walls (e.g., of fungi or Gram-positives) for better analyte release [20]. | Apply directly to colony before paper spray, or mix with spray solvent. |
| Paper Spray Substrate | Porous cellulose paper (e.g., Whatman Grade 1) | Acts as a disposable sample holder, extraction medium, and electrospray emitter. | Triangle geometry is critical for stable spray formation [21]. |
| Ion Mobility Calibrant | Solution of Poly-DL-alanine or Tune Mix (e.g., ESI-L Low Concentration Tune Mix) | Provides known drift times for calibrating and calculating Collision Cross-Section (CCS) values. | CCS is a reproducible, instrument-independent identifier for lipids [20]. |
| Quality Control Strain | E. coli DH5α or Bacillus subtilis 168 | Provides a consistent biological reference for system performance and spectral library validation. | Run at the start and end of each batch to monitor instrumental drift. |
| Matrix for MALDI Comparison | α-Cyano-4-hydroxycinnamic acid (HCCA) in 50% ACN/2.5% TFA | For comparative studies with the current MALDI-TOF MS standard method. | Highlights the "matrix-free" advantage of true ambient techniques [20]. |
From Colony to Data: Optimized Workflows for Species and Strain-Level Discrimination
The integration of ambient ionization mass spectrometry (MS) into microbiological research represents a paradigm shift, enabling the direct, rapid, and minimally invasive analysis of microbial colonies. Within the context of a broader thesis on this field, this article details three foundational direct sampling protocols: Touch Spray (TS), the MasSpec Pen (MSPen), and Liquid Extraction from Agar. These techniques bypass extensive sample preparation, allowing for the real-time detection of lipids, metabolites, and other biomarkers critical for microbial identification, phenotypic characterization, and the study of host-microbe interactions [22] [23] [20]. Their application accelerates diagnostics, supports antimicrobial stewardship, and provides a powerful toolkit for fundamental research in drug development and systems microbiology [24] [25].
Protocol 1: Touch Spray Mass Spectrometry
Touch Spray is a spray-based ambient ionization method that uses a handheld probe for in situ sampling. A small amount of material is transferred to a roughened metallic probe, which is then subjected to a high voltage in the presence of solvent to generate an electrospray for direct MS analysis [22].
Detailed Experimental Protocol
- Sample Collection: Using a sterile, roughened metallic probe (e.g., a teasing needle), gently touch, swipe, or scrape the surface of a microbial colony or biological tissue to transfer a micro-sample to the probe tip [22].
- Probe Positioning: Manually position the probe 0.5–20 mm from the inlet of the mass spectrometer [22].
- Solvent Application: Apply a small volume (0.1–2 µL) of appropriate MS-grade solvent (e.g., methanol, methanol/acetonitrile) manually via pipette onto the probe tip near the sampled material. Alternatively, for sustained signal, deliver solvent continuously via a syringe pump [22].
- Ionization: Apply a high voltage (3.0–5.0 kV) to the probe to initiate a stable electrospray, emitting charged micro-droplets containing the extracted analytes into the MS inlet [22].
- Data Acquisition: Acquire mass spectra in either positive or negative ion mode. Spectral acquisition typically lasts seconds with manual solvent application or over a minute with continuous flow [22].
- Data Analysis: Process spectra to identify lipid or metabolite profiles. For microbial identification, use multivariate statistical tools (e.g., Principal Component Analysis, Linear Discriminant Analysis) to compare against reference spectral libraries [20].
Touch Spray Workflow Diagram
The following diagram illustrates the key steps in the Touch Spray process from sampling to data analysis.
Protocol 2: MasSpec Pen Analysis
The MasSpec Pen is a handheld, non-destructive device that uses a discrete water droplet for ambient molecular extraction. The droplet is held in contact with a sample surface, absorbs analytes, and is then automatically aspirated into the mass spectrometer for analysis [24] [25].
Detailed Experimental Protocol
- Sample Preparation: For cultured isolates, transfer a single microbial colony to a clean glass slide. For direct tissue analysis, position the specimen for probe access [24] [25].
- Pen Positioning: Bring the MasSpec Pen tip into gentle, vertical contact with the sample surface.
- Droplet Extraction: A system-controlled volume of water (e.g., 10 µL) is dispensed to form a liquid junction with the sample. Hold this contact for ~3 seconds to allow analyte extraction into the droplet [24].
- Aspiration & Transfer: The droplet is automatically retracted from the surface and aspirated through flexible tubing to the mass spectrometer inlet.
- Ionization & Acquisition: The analytes in the aqueous droplet are ionized via standard electrospray ionization. Acquire high-resolution mass spectra (e.g., on a Q Exactive instrument) typically in negative ion mode for lipids and metabolites [24].
- Statistical Classification: Process raw spectra to remove background signals (e.g., from culture media). Use machine learning classifiers (e.g., Lasso – Least Absolute Shrinkage and Selection Operator) trained on known spectral profiles to identify the microorganism or tissue state [24] [25].
MasSpec Pen Workflow Diagram
The diagram below outlines the automated, droplet-based sampling and analysis process of the MasSpec Pen system.
Protocol 3: Liquid Extraction from Agar
This protocol involves the physical excision of agar plugs containing microbial colonies or root exudates, followed by a biphasic solvent extraction to recover a broad range of metabolites for subsequent LC-MS/MS analysis [26].
Detailed Experimental Protocol
- Spatial Sampling: Using the wide end of a sterile pipette tip, cut and excise agar plugs from specific regions of interest on the culture plate (e.g., from the colony center, periphery, or distant regions for spatial metabolomics) [26].
- Freeze-drying: Immediately freeze plugs in liquid nitrogen and lyophilize to complete dryness.
- Biphasic Extraction:
- Add equal volumes (e.g., 1 mL each) of ice-cold LC-MS grade water and hydrated ethyl acetate to the dried agar plug [26].
- Vortex vigorously for 1 minute to homogenize.
- Incubate at 4°C overnight to maximize metabolite extraction.
- Phase Separation: Centrifuge the mixture at maximum speed for 10 minutes at 4°C to achieve clear phase separation.
- Fraction Processing:
- Aqueous Phase (Polar Metabolites): Carefully collect the upper aqueous layer. Filter through a 10 kDa centrifugal filter. Lyophilize and reconstitute in a suitable MS-compatible aqueous solvent (e.g., 98% water, 2% acetonitrile with 0.1% formic acid) [26].
- Organic Phase (Non-polar Metabolites): Collect the lower ethyl acetate layer. Evaporate to complete dryness in a fume hood. Reconstitute the residue in an organic MS solvent (e.g., 70% acetonitrile with 0.1% formic acid) [26].
- LC-MS/MS Analysis: Analyze both fractions using complementary liquid chromatography methods (e.g., reversed-phase for organic fraction, HILIC for aqueous fraction) coupled to tandem mass spectrometry for targeted or untargeted metabolomics.
Liquid Extraction from Agar Workflow Diagram
This diagram shows the process from spatial sampling of agar to the preparation of distinct metabolite fractions for LC-MS analysis.
Comparative Analysis of Direct Sampling Protocols
Table 1: Comparative analysis of Touch Spray, MasSpec Pen, and Liquid Extraction from Agar protocols for microbial analysis.
| Parameter | Touch Spray (TS) | MasSpec Pen (MSPen) | Liquid Extraction from Agar |
|---|---|---|---|
| Core Principle | Probe-based mechanical sampling & in-situ electrospray [22] | Discrete water droplet extraction & automated ESI [24] [25] | Physical excision & biphasic solvent extraction [26] |
| Analytical Time | Seconds to minutes [22] | ~15 seconds per sample [25] | Hours to days (incl. extraction & LC-MS) [26] |
| Spatial Resolution | Low to medium (user-guided probe) [22] | Medium (defined by droplet size) [24] | High (defined by plug excision) [26] |
| Microbial ID Accuracy | Species-level differentiation demonstrated [20] | 99% (culture isolates), direct from tissue [25] | Not primary ID method; used for comprehensive profiling |
| Sample Throughput | Moderate (manual sampling) | High (automated droplet handling) | Low (manual, multi-step process) |
| Molecular Coverage | Lipids, small metabolites [22] [20] | Lipids, metabolites (~400 features) [25] | Broadest (polar & non-polar metabolome) [26] |
| Key Advantage | Simple setup, flexible for various surfaces [22] | Rapid, automated, tissue-compatible [24] [25] | Comprehensive, quantitative, compatible with spatial mapping [26] |
| Main Limitation | Semi-quantitative, user-dependent reproducibility [22] | Limited penetration depth, aqueous solvent only | Destructive, slow, requires extensive processing [26] |
The Scientist's Toolkit: Essential Research Reagents & Materials
Table 2: Key reagents, materials, and instruments required for implementing the featured direct sampling protocols.
| Item | Primary Function | Protocol(s) | Technical Notes |
|---|---|---|---|
| Roughened Metallic Probes | Physical sampling and application of high voltage for electrospray [22]. | Touch Spray | Teasing needles or custom-etched wires. Roughened surface enhances sample retention [22]. |
| MasSpec Pen Device | Automated dispensing and aspiration of water droplet for ambient extraction [24] [25]. | MasSpec Pen | Handheld device interfaced with mass spectrometer via flexible tubing. |
| High-Voltage Power Supply | Applying potential (3-5 kV) to generate electrospray [22]. | Touch Spray, MasSpec Pen | Standard component of ESI sources. |
| MS-Grade Solvents | Extraction and ionization medium. | All | Touch Spray: Methanol, acetonitrile [22]. MasSpec Pen: Water [24]. Agar Extraction: Water, ethyl acetate [26]. |
| High-Resolution Mass Spectrometer | Detection and mass analysis of ions. | All | Q-TOF, Orbitrap, or Ion Mobility-MS preferred for untargeted analysis [24] [20]. |
| Liquid Chromatography System | Separation of complex extracts prior to MS. | Liquid Extraction from Agar | Essential for deep metabolome coverage of biphasic extracts [27] [26]. |
| Statistical & Bioinformatics Software | Processing spectra, multivariate analysis, and classification. | Touch Spray, MasSpec Pen | Tools for PCA, LDA, Lasso regression, and machine learning are critical for ID [24] [20] [25]. |
| Cryogrinder & Lyophilizer | Homogenizing and drying solid samples for extraction. | Liquid Extraction from Agar | Necessary for processing agar plugs or tissue to a dry, uniform powder [26]. |
| 10 kDa Centrifugal Filters | Removing proteins and particulates from aqueous extracts. | Liquid Extraction from Agar | Prevents column clogging and reduces matrix effects in LC-MS [26]. |
The integration of ion mobility spectrometry (IMS) with ambient mass spectrometry (MS) represents a transformative advancement for the direct analysis of microbial colonies. This multidimensional approach directly addresses the core challenges in microbial metabolomics and proteomics: the isobaric interferences and structural complexity inherent to samples analyzed with minimal preparation [20]. By adding a rapid, gas-phase separation dimension that resolves ions based on their size, shape, and charge, IMS significantly enhances the selectivity of ambient MS techniques like paper spray (PS) or desorption electrospray ionization (DESI) [20] [28]. This is critical within the thesis framework of ambient MS for direct microbial analysis, as it enables the differentiation of microbial strains and species based not only on their mass spectral fingerprints but also on the distinct collision cross-section (CCS) values of their lipid, metabolite, and protein biomarkers [20]. Furthermore, IMS provides a unique window into the conformational landscapes of biomolecules, such as proteins, directly desorbed from colonies, offering insights into functional states and post-translational modifications that are invisible to MS alone [29]. This coupling moves the field beyond simple identification towards a deeper, structurally-resolved chemical phenotyping of microbial systems in their native state [2] [30].
Core Principles: How IMS Enhances Selectivity and Resolves Conformers
Ion mobility spectrometry separates ions in the gas phase based on their differential mobility through a buffer gas under the influence of an electric field. An ion's mobility (K) is related to its collision cross section (CCS), a physicochemical property describing its rotationally averaged size and shape [28] [31]. Compact ions traverse the drift tube faster than elongated ions of the same mass-to-charge ratio (m/z), providing an orthogonal separation dimension to MS [32].
This principle dramatically enhances selectivity in complex microbial samples. Isomeric lipids or metabolites that are co-selected and co-fragmented in traditional tandem MS experiments can be separated in the IMS dimension prior to mass analysis. This allows for the isolation and independent fragmentation of individual isomers, leading to cleaner MS/MS spectra and more confident identifications [20] [28]. For instance, phospholipids from different bacterial strains can share identical m/z values but exhibit distinct CCS values due to subtle differences in acyl chain packing or isomerization, enabling strain-level discrimination [20].
For conformer separation, IMS is unparalleled among rapid, gas-phase techniques. Proteins and protein complexes can exist in multiple folded, partially folded, or unfolded conformations. These conformers, which have identical sequences and m/z, possess different three-dimensional structures and thus different CCS values. High-resolution IMS platforms, such as drift-tube IMS (DTIMS) or trapped IMS (TIMS), can resolve these populations [28] [29]. Studying protein conformers directly from microbial colonies—such as membrane proteins extracted via native ambient MS—can reveal functional states, ligand binding, and the impact of genetic mutations or environmental stress on protein structure [33] [29].
Table 1: Key IMS Platforms and Their Characteristics for Microbial Analysis
| Platform | Separation Principle | Key Advantages for Microbial Analysis | Typical Resolving Power (t/Δt) |
|---|---|---|---|
| Drift-Tube IMS (DTIMS) | Uniform electric field in a static gas [28]. | Primary method for CCS determination; excellent for isomer/conformer separation [28] [31]. | ~50-250 [28] |
| Traveling Wave IMS (TWIMS) | Moving waves of potential through a gas [28]. | High sensitivity; commonly integrated with commercial MS systems [28]. | Calibrated to DTIMS CCS values [28]. |
| Trapped IMS (TIMS) | Electric field gradient opposes gas flow to trap ions [28]. | Very high resolving power; excellent for complex mixtures [28]. | >200 [28] |
| Field Asymmetric IMS (FAIMS) | Differential mobility in high/low alternating fields [29]. | Continuous operation at atmospheric pressure; filters chemical noise [32] [29]. | Selectivity based on field-dependent mobility differences [29]. |
Quantitative Performance Data in Microbial Applications
The coupling of ambient ionization with IMS-MS delivers concrete performance metrics that surpass ambient MS alone. The added separation dimension reduces spectral complexity, improves signal-to-noise ratios, and provides a stable, reproducible molecular descriptor in the form of CCS values.
Table 2: Performance Metrics for Microbial Analysis Using IMS-Coupled Techniques
| Application / Technique | Key Performance Metric | Result | Implication |
|---|---|---|---|
| Species-Level Discrimination (PS-IM-MS) [20] | Prediction accuracy for 6 Gram-positive species | 98% (using negative ions) | IMS separation of lipid isomers enables high-accuracy identification with minimal prep. |
| Strain-Level Discrimination (PS-IM-MS/MS) [20] | Ability to differentiate 7 E. coli strains | Successful via IMS-MS/MS of phospholipid ions | Strain-specific lipid isomer ratios are resolvable in the IMS dimension. |
| Volatile Metabolome Analysis (MCC-IMS) [34] | Number of specific VOC signals for Proteus mirabilis | Up to 21 specific signals detected | IMS provides rich, strain-specific volatile fingerprinting for rapid diagnosis. |
| Conformer Analysis (ESI-FAIMS-MS) [29] | Number of resolved conformers for bovine ubiquitin (+8 charge state) | At least 3 distinct conformers resolved | FAIMS can separate protein conformational populations related to solution conditions. |
| Digital Polymer Sequencing (MALDI-IMS-MS/MS) [35] | Sequencing throughput enhancement via IMS | Full gas-phase workflow in a single run; enables parallelization | IMS organizes fragments by mobility, simplifying complex sequencing data. |
Detailed Experimental Protocols
Objective: To rapidly generate characteristic, reproducible mass spectral fingerprints directly from microbial colonies for species-level identification using paper spray ionization coupled with IMS-MS.
- Sample Preparation:
- Using a sterile loop or pipette tip, transfer a minute quantity (≈1 µg) of a microbial colony grown on an agar plate directly onto the vertex of a pre-cut triangular paper substrate.
- No additional extraction, washing, or matrix application is required.
- IMS-MS Analysis:
- Position the paper triangle in front of the mass spectrometer inlet. Apply a small volume (≈10-20 µL) of spray solvent (e.g., 90:10 methanol:water with 0.1% formic acid for positive mode) to the paper.
- Apply a high voltage (≈3-5 kV) to the paper substrate to initiate the paper spray.
- Ions are generated at atmospheric pressure and introduced into the IMS drift cell. Key IMS parameters: Drift gas (N₂ or He), drift voltage (optimized for separation of m/z 500-1500), and cell temperature.
- Ions are separated based on mobility and subsequently analyzed by a high-resolution time-of-flight (TOF) mass analyzer.
- Data Processing:
- Acquire data in both positive and negative ionization modes.
- Process arrival time distributions (ATDs) to extract collision cross section (CCS) values for major ion features.
- Use software (e.g., MassHunter, DriftScope) to create 2D heat maps of m/z vs. drift time.
- For statistical analysis, export CCS and intensity data for multivariate analysis (e.g., PCA, LDA) to build classification models.
Objective: To capture the volatile metabolome fingerprint of microbial cultures for rapid pathogen identification.
- Culture and Sampling:
- MCC-IMS Analysis:
- Direct a portion of the headspace gas through a multi-capillary column (MCC), which provides a fast pre-separation of VOCs based on volatility and polarity.
- The eluent from the MCC is introduced into the IMS ionization region, typically using a radioactive (³⁶³Ni) or corona discharge ionization source.
- Ionized analytes enter the drift tube. Operating conditions are typically atmospheric pressure and elevated temperature (to prevent condensation).
- Detection and Identification:
- Separated ion peaks are detected as an ion current at the Faraday plate. The result is a 2D spectrum of retention time (MCC) vs. drift time (IMS).
- Identify peaks by comparing their coordinates to an internal database of known VOCs or by validating with parallel GC-MS analysis [34].
Objective: To detect and separate conformers of membrane proteins directly from bacterial colonies.
- Surface Sampling and Washing:
- Employ a liquid extraction surface analysis (LESA) or liquid microjunction probe. Position the probe over a bacterial colony.
- Deliver a small volume (≈5-10 µL) of a gentle, native-like extraction solvent (e.g., 200 mM ammonium acetate with a mild detergent) to solubilize membrane proteins [33].
- A key step is an optional, quick on-surface wash with water or ammonium acetate to attenuate soluble cytoplasmic proteins and enrich for membrane-associated complexes [33].
- Native Electrospray Ionization and FAIMS Separation:
- Aspirate the extract and directly infuse it into an electrospray ionization (ESI) source optimized for native MS (low voltages, minimal heating).
- Direct the ions into a FAIMS (Field Asymmetric IMS) device. FAIMS operates at atmospheric pressure and uses a high-frequency asymmetric waveform to filter ions [29].
- By scanning the compensation voltage (CV), different conformers of the same protein charge state are selectively transmitted. For example, multiple conformers of the +8 charge state of ubiquitin can be resolved [29].
- MS Analysis and CCS Determination:
- Mass analyze the FAIMS-filtered ions with a high-mass-range mass spectrometer.
- For CCS determination, the FAIMS-filtered ions can be introduced into a DTIMS cell for precise CCS measurement, linking a specific conformation (filtered by FAIMS) to a definitive CCS value.
Visualizing Workflows and Relationships
Multidimensional Separation Workflow for Microbial Analysis
Generalized Experimental Protocol for IMS-MS Microbial Analysis
The Scientist's Toolkit: Essential Research Reagents and Materials
Table 3: Key Reagents and Materials for IMS-Coupled Ambient Microbial MS
| Item | Function/Description | Example/Notes |
|---|---|---|
| Chromatography Paper | Substrate for paper spray ionization. The cellulose matrix wicks solvent and supports the applied high voltage [20]. | Whatman Grade 1 or similar qualitative filter paper. |
| Ambient Spray Solvents | Solvent systems for ambient ionization. Must efficiently extract analytes and support stable electrospray [20]. | Positive mode: Methanol/Water with 0.1% formic acid. Negative mode: Methanol/Water with ammonium hydroxide. |
| Native MS Buffer | Volatile buffer for extracting and ionizing proteins under non-denaturing conditions to preserve conformers [33] [29]. | 100-200 mM ammonium acetate (pH ~7). Additives like charge modifiers may be used. |
| Drift Gas | Inert gas filling the IMS drift cell. Ion-neutral collisions with this gas effect the mobility separation [28] [31]. | High-purity Nitrogen (N₂) or Helium (He). Purity is critical for reproducibility. |
| IMS Calibrant Standards | Compounds with well-characterized CCS values used to calibrate the IMS drift time scale, enabling accurate CCS determination [28]. | Tune mix ions (e.g., tetraalkylammonium salts) or major lipid ions from a standard extract. |
| Selective Growth Media | Agar media used to culture specific microbes. Media composition influences the lipid and metabolite profile [34] [30]. | Columbia blood agar for pathogens; specialized media for secondary metabolite induction [34]. |
| FAIMS Compensation Gas | Gas flowing in the FAIMS device that carries ions and influences separation selectivity [29]. | Nitrogen, often pre-heated and humidified to stabilize ion behavior. |
1. Introduction & Thesis Context
The rapid and accurate identification of microorganisms is a cornerstone of clinical diagnostics, pharmaceutical quality control, and public health surveillance. Within the broader thesis research on ambient mass spectrometry for direct microbial colony analysis, a central challenge is transforming complex spectral data into actionable, high-confidence taxonomic predictions [36]. Traditional analysis pipelines often struggle with the high-dimensionality and inherent noise of mass spectral data, where each spectrum comprises thousands of m/z (mass-to-charge ratio) intensity values.
This application note details a robust data analysis pipeline that integrates Principal Component Analysis (PCA) for unsupervised dimensionality reduction, Linear Discriminant Analysis (LDA) for supervised feature projection, and advanced machine learning (ML) classifiers to achieve high prediction rates [37]. The pipeline is specifically designed for direct microbial profiling, aligning with the growing market for automated, high-throughput Mass Spectrometry Microbial Identification Systems, a sector projected to reach $2.5 billion by 2025 [36]. By embedding AI-driven analysis, this approach addresses the critical need for precision in exposomics and the ambition of projects like the Human Exposome Project, which seeks to comprehensively map environmental influences on health [38].
2. Core Algorithmic Foundations: PCA & LDA
The pipeline employs a two-stage dimensionality reduction strategy to distill the most informative features from raw spectral data before classification.
- Principal Component Analysis (PCA): An unsupervised algorithm used for noise reduction and exploratory data analysis. PCA identifies orthogonal axes (principal components) in the data that capture the maximum variance, irrespective of class labels (e.g., microbial species). This step simplifies the dataset, reduces computational load, and mitigates the "curse of dimensionality" by transforming the original high-dimensional spectra into a lower-dimensional space of uncorrelated components [37].
- Linear Discriminant Analysis (LDA): A supervised algorithm applied after PCA. LDA seeks axes that maximize the separation between predefined classes (different microbial species) while minimizing the variance within each class. It projects the PCA-reduced data into a new space where the classes are as distinct as possible, creating an optimal foundation for a classifier [37].
The table below summarizes and contrasts the roles of PCA and LDA within the pipeline:
Table 1: Comparative Characteristics of PCA and LDA in Spectral Analysis
| Feature | Principal Component Analysis (PCA) | Linear Discriminant Analysis (LDA) |
|---|---|---|
| Objective | Maximize variance in data; reduce dimensionality [37] | Maximize separation between known classes [37] |
| Learning Type | Unsupervised (ignores class labels) | Supervised (requires class labels) |
| Primary Role in Pipeline | Noise reduction, feature compression, exploratory analysis | Creating an optimal discriminative subspace for classification |
| Output | Components ranked by explained variance | Linear discriminants ranked by class separability |
| Key Mathematical Focus | Covariance matrix of the entire dataset | Within-class and between-class scatter matrices [37] |
3. Predictive Modeling & Machine Learning Integration
The features projected by LDA serve as input to machine learning classifiers. The choice of model is critical for achieving high prediction rates. This pipeline evaluates several algorithms:
- Random Forest (RF): An ensemble method that constructs multiple decision trees. It is highly effective for classification tasks, resistant to overfitting, and can handle complex, non-linear relationships in data. Its ability to estimate feature importance provides insight into which m/z values are most discriminatory for specific microbes [39].
- Gradient Boosting Machines (GBM): Another powerful ensemble technique that builds trees sequentially, with each new tree correcting the errors of the previous ones. It often achieves very high accuracy and is well-suited for heterogeneous spectral data [39].
- Support Vector Machines (SVM): Effective for finding the optimal hyperplane that separates different classes in high-dimensional space. SVMs are particularly potent when a clear margin of separation exists in the LDA-projected data [40].
Model performance is rigorously evaluated using out-of-sample testing methods like k-fold cross-validation to prevent over-optimistic results from in-sample evaluation [41]. Key metrics include:
- Accuracy: Overall proportion of correct predictions.
- Precision & Recall: Critical for imbalanced datasets; precision measures reliability of positive predictions, while recall measures the ability to find all positive instances.
- F1-Score: The harmonic mean of precision and recall.
- Confusion Matrix: A detailed breakdown of predictions versus actual labels, essential for identifying inter-species confusion [41].
Table 2: Typical Performance Metrics for Microbial Classification Models
| Model | Average Accuracy (Range) | Key Strength | Consideration for Spectral Data |
|---|---|---|---|
| Random Forest | High (92-98%) [39] | Robust to outliers, provides feature importance | May be computationally intensive with many trees |
| Gradient Boosting | Very High (94-99%) [39] | High predictive accuracy, handles mixed data types | Requires careful tuning to avoid overfitting |
| Support Vector Machine | High (90-97%) [40] | Effective in high-dimensional spaces, versatile kernels | Performance sensitive to kernel and parameter choice |
4. Application Notes: Protocol for Direct Microbial Colony Analysis
4.1 Experimental Workflow Overview The complete analytical workflow, from sample preparation to species prediction, is visualized in the following diagram.
4.2 Detailed Protocol: Spectral Acquisition & Data Generation
Materials:
- Microbial colonies cultured on standard agar plates (18-24 hr growth).
- Ambient Mass Spectrometer (e.g., equipped with DESI or DART ion source) [36].
- Conductive sample target plates.
- Internal standard solution (optional, for calibration).
Procedure:
- Using a sterile loop, perform a direct colony transfer by lightly touching a single, well-isolated microbial colony and smearing it onto a pre-defined spot on the sample target plate. No extensive extraction is required.
- Allow the sample spot to air-dry for approximately 30-60 seconds.
- Insert the target plate into the ambient MS ion source.
- Acquire mass spectra in the positive ion mode, typically over a range of m/z 2,000 to m/z 20,000, which captures the characteristic ribosomal protein profiles. Accumulate spectra for 1-2 seconds per sample spot from multiple micro-locations within the smear.
- For system calibration and quality control, analyze a known bacterial standard (e.g., E. coli DH5α) at the beginning of the batch and after every 10-15 samples.
- Export raw spectral data in a standard format (e.g., .mzML, .txt) for downstream processing.
4.3 Detailed Protocol: Data Analysis Pipeline
Software & Tools: Python (scikit-learn, numpy, pandas) or R environment.
Step 1: Data Preprocessing
- Load Data: Import all raw spectral files.
- Baseline Correction: Apply an algorithm (e.g., asymmetric least squares) to remove instrumental background noise.
- Spectral Alignment: Align peaks across all spectra to correct for minor m/z drift using a reference spectrum.
- Normalization: Normalize the total ion current (TIC) or vector norm for each spectrum to enable comparative analysis.
- Peak Picking & Binning: Identify prominent peaks and bin m/z values within a defined tolerance (e.g., ±0.5 Da) to create a consistent feature set across all samples.
- Construct Matrix: Build an
n x mdata matrix wherenis the number of spectra (samples) andmis the number of binned m/z features (intensity values).
Step 2: Dimensionality Reduction & Projection The core two-stage reduction process is illustrated below, contrasting the mechanics of PCA and LDA.
Procedure for Step 2:
- PCA Transformation: Center the data matrix (mean = 0). Compute the covariance matrix and perform eigen decomposition. Select the top
kprincipal components that explain >95% of the cumulative variance. Transform the original data into thek-dimensional PC space [37]. - LDA Projection: Using the known class labels (species identity) for the training set, compute the within-class and between-class scatter matrices on the PCA-transformed data. Perform eigen decomposition to find the linear discriminants (LDs). Project the PCA-reduced data onto the
c-1LDs (wherecis the number of unique classes) [37].
Step 3: Model Training, Validation & Prediction The final stage integrates the processed data into a predictive machine learning workflow.
Procedure for Step 3:
- Partition Data: Split the LDA-projected dataset and corresponding labels into a training set (e.g., 70-80%) and a held-out test set (20-30%).
- Train Classifier: Train a chosen ML model (e.g., Random Forest) on the training set.
- Hyperparameter Tuning: Use k-fold cross-validation (e.g., k=5 or 10) on the training set only to optimize model hyperparameters (e.g., number of trees in RF, kernel for SVM) [41].
- Final Evaluation: Apply the finalized, tuned model to the held-out test set, which it has never seen during training or tuning. Generate predictions and calculate performance metrics (Accuracy, Precision, Recall, F1-Score, Confusion Matrix) [41].
- Prediction on Unknowns: For new, unknown microbial spectra, preprocess the data identically, transform it using the fitted PCA and LDA models, and use the trained classifier to generate a species prediction along with a probability or confidence score.
5. The Scientist's Toolkit: Essential Research Reagents & Materials
Table 3: Key Reagents and Materials for the Ambient MS Microbial ID Pipeline
| Item | Function / Role in Pipeline | Specifications / Notes |
|---|---|---|
| Bacterial Standard Strains | Quality control, system calibration, and model training. | Certified strains from culture collections (e.g., ATCC). Essential for building a reference spectral library [36]. |
| Chromatographic Solvents (HPLC-MS Grade) | Mobile phase for optional extraction or source cleaning. | Acetonitrile, methanol, water with 0.1% formic acid. Purity minimizes background chemical noise [38]. |
| Internal Standard Solution | Spectral calibration and data normalization. | Contains compounds of known mass (e.g., proprietary protein/peptide mix) spiked into samples for m/z alignment. |
| Conductive Sample Targets | Substrate for direct colony analysis. | Usually stainless steel or coated glass plates compatible with the MS ion source. |
| Matrix Compound (for MALDI) | Required for MALDI-based ambient ionization. | α-cyano-4-hydroxycinnamic acid (CHCA) or sinapinic acid (SA), depending on mass range [36]. |
| AI/ML Software Platform | Execution of PCA, LDA, and classification algorithms. | Python with scikit-learn, R, or commercial software with AI integration for predictive analytics [39] [38]. |
| Reference Spectral Library | Core database for model training and validation. | Can be commercially sourced (e.g., from system vendors) or built in-house using standard strains. Critical for LDA supervision [36]. |
The direct analysis of microbial colonies by ambient mass spectrometry (MS) represents a paradigm shift in microbiological analytics, enabling the rapid, in-situ interrogation of pathogens, their resistance profiles, and the purity of production strains. This approach bypasses extensive sample preparation and chromatographic separation, allowing biomolecules (primarily proteins and lipids) to be desorbed and ionized directly from the colony surface or a minimally processed sample [2]. Techniques such as Matrix-Assisted Laser Desorption/Ionization Time-of-Flight (MALDI-TOF) MS have transitioned from research tools to FDA-cleared clinical diagnostics for pathogen identification [2]. This set of application notes details protocols for leveraging these direct analysis principles in three critical areas: identifying pathogens from clinical specimens, rapidly screening for antimicrobial resistance (AMR), and ensuring colony purity in pharmaceutical development, framed within the broader thesis of advancing ambient MS methodologies.
Application Note 1: Clinical Pathogen Identification from Positive Blood Cultures
Objective: To rapidly and accurately identify bacterial pathogens directly from flagged positive blood culture bottles using MALDI-TOF MS, reducing turnaround time compared to routine subculture methods [42].
Background: Bloodstream infections (BSI) are medical emergencies where mortality rates increase significantly with delayed appropriate therapy. Conventional culture-based identification can take over 24 hours post-positivity [42]. Direct analysis from blood culture broth using detergent-based pelleting protocols can provide species identification within approximately 30 minutes of sample preparation [42].
Experimental Protocol
- Sample: 1-1.5 mL of broth from a positively flagged aerobic blood culture bottle (e.g., BD BACTEC FX40) confirmed by Gram stain to contain a single morphotype [42].
- Key Reagent Selection: Choose one detergent for host cell lysis:
- Procedure:
- Transfer the broth-detergent mix to a sterile microcentrifuge tube and vortex.
- Centrifuge at 13,000 rpm for 1 minute at 4°C. Discard supernatant.
- Wash pellet with 1.5 mL of 0.9% saline and repeat centrifugation. Discard supernatant.
- Air-dry the pellet for 10 minutes at room temperature.
- Add 50 µL of 30% formic acid to the pellet, vortex, and centrifuge again at 13,000 rpm for 1 minute.
- Apply 1 µL of the supernatant (containing bacterial proteins) to a MALDI target plate.
- Overlay with 1 µL of α-cyano-4-hydroxycinnamic acid (CHCA) matrix solution. Allow to dry completely.
- Acquire spectra using a MALDI-TOF MS system (e.g., VITEK MS or Bruker Biotyper).
- Compare the acquired mass fingerprint (typically m/z 2,000-20,000) against a validated reference database. A confidence score ≥ 90.0% is generally acceptable for genus- or species-level identification [42].
Results & Data Analysis: A 2025 study evaluating this protocol demonstrated high categorical agreement with standard subculture methods, with Triton X-100 showing the highest performance [42].
Table 1: Performance of Direct MALDI-TOF ID from Positive Blood Cultures [42]
| Lysis Reagent | Agreement with Standard Method | Key Advantage |
|---|---|---|
| Triton X-100 (10%) | 96.2% | Highest agreement; robust lysis. |
| SDS (10%) | 91.8% | Effective for a broad range of bacteria. |
| Saponin (4%) | 90.0% | Gentler alternative. |
Application Note 2: Rapid Screening for Methicillin Resistance inS. aureusvia Deuterium Labeling
Objective: To determine methicillin resistance in Staphylococcus aureus within 3 hours using a MALDI-TOF MS-based assay that monitors bacterial growth via deuterium (D₂O) incorporation into newly synthesized lipids [43].
Background: Traditional antimicrobial susceptibility testing (AST) requires overnight incubation. This protocol uses stable isotope labeling coupled with ambient MS. Resistant bacteria continue to synthesize new lipids in the presence of antibiotics, incorporating deuterium from the medium and causing a detectable mass shift [43].
Experimental Protocol
- Sample Preparation: Prepare a bacterial suspension (~8x10⁸ CFU/mL) of S. aureus from an overnight agar plate in Mueller-Hinton broth [43].
- On-Target Microculture: Spot 2.5 µL of bacterial suspension and 2.5 µL of 40% D₂O in Mueller-Hinton broth (containing a defined concentration of methicillin, e.g., 10 µg/mL) directly onto a MALDI target plate. This creates a final culture in 20% D₂O with antibiotic [43].
- Incubation: Place the target in a humidified chamber with a D₂O-saturated atmosphere to prevent evaporation. Incubate at 37°C for 2-4 hours.
- Sample Processing & Analysis:
- Dry the microdroplet spots on a hot plate (~75°C).
- Lyse cells by applying 1 µL of 70% ethanol twice, allowing to dry between applications.
- Wash with 3 µL of water to remove salts; wick away after 30 seconds.
- Apply 1 µL of N-(1-naphthyl) ethylenediamine dihydrochloride (NEDC) matrix in 50% methanol.
- Acquire mass spectra in negative ion mode to detect bacterial lipids (e.g., phosphatidylglycerols, m/z ~700-800).
- Data Interpretation: Calculate the average mass of the lipid peaks. A significant decrease in the average mass (less deuterium incorporation) in the antibiotic-treated sample compared to an untreated control indicates susceptibility. A maintained average mass (continued deuterium incorporation) indicates resistance [43].
The Scientist's Toolkit: AMR Screening
- Deuterium Oxide (D₂O): A non-radioactive, stable heavy water isotope incorporated into newly synthesized biomolecules during growth, serving as a metabolic activity reporter [43].
- NEDC Matrix: A MALDI matrix optimized for the ionization of lipids in negative ion mode, crucial for detecting bacterial membrane phospholipids [43].
- Methicillin Antibiotic: The β-lactam antibiotic used to challenge S. aureus strains, differentiating Methicillin-Resistant S. aureus (MRSA) from susceptible strains (MSSA).
- Humidified Incubation Chamber: Prevents evaporation of nanoliter-scale microcultures on the MALDI target, ensuring consistent assay conditions [43].
Visualization: The workflow and core mechanism of the deuterium labeling assay for rapid AST is illustrated below.
Application Note 3: Analysis of Pharmaceutical Production Colony Purity
Objective: To ensure the genetic and phenotypic purity of microbial colonies used in pharmaceutical production (e.g., for probiotics, enzyme production, or live biotherapeutic products) using a combination of digital plating and direct MS profiling.
Background: Contamination or genetic drift in production strains can compromise product safety and efficacy. Traditional purity checks are slow and low-resolution. Integrating high-resolution digital plating for single-cell isolation with direct MS analysis of colony chemistry provides a robust quality control pipeline.
Experimental Protocol
Part A: High-Resolution Colony Isolation via Digital Plating [44]
- Sample Loading: Introduce a diluted suspension of the microbial production strain into the inlet of a degassed PicoArray device—a microfluidic chip containing >100,000 picoliter-scale microwells.
- Single-Cell Partitioning: A self-pumping mechanism partitions the suspension, statistically isolating single cells into individual microwells.
- Cultivation: Cover the chip with a replaceable, nutrient-laden agar sheet. Incubate to allow confined growth of microcolonies from single cells.
- Imaging & Picking: After 6-8 hours (vs. 16-24h for macro-colonies), image the array. Identify and flag microwells containing pure, well-isolated microcolonies for downstream analysis.
Part B: Direct MS Profiling for Phenotypic Consistency
- Microcolony Sampling: Using a fine probe, extract material from multiple microcolonies grown from the same production strain across different digital plating arrays.
- Direct MALDI-TOF MS Analysis: Apply each sample spot directly to a MALDI target with HCCA matrix.
- Spectral Acquisition & Comparison: Acquire protein/lipid mass fingerprints. Use software to align and compare spectra from multiple colonies.
- Analysis: High spectral similarity (e.g., via cosine correlation or principal component analysis) indicates phenotypic consistency and colony purity. Outlier spectra suggest potential contaminant colonies or sub-populations with divergent expression profiles.
Integrated Solution: This combined approach allows for the rapid screening of thousands of clonal lineages from a production batch. The digital plating platform provides physical purity at the single-cell level and accelerates growth, while direct MS profiling confirms the biochemical homogeneity of the resulting biomass, a critical metric for quality assurance in pharmaceutical microbiology [44].
Visualization: The integrated workflow for ensuring pharmaceutical colony purity is shown below.
Regulatory and Methodological Context
The implementation of these direct analysis methods occurs within an evolving regulatory landscape. For AST, the alignment between the Clinical and Laboratory Standards Institute (CLSI) and the U.S. Food and Drug Administration (FDA) on interpretive criteria (breakpoints) is critical. Recent recognition of CLSI standards (e.g., M100, M45) by the FDA facilitates the use of updated, clinically relevant breakpoints for novel methods and antimicrobial-organism combinations [45]. Furthermore, robust, publicly available spectral databases are fundamental for accurate identification, especially for rare or highly pathogenic bacteria. Specialized databases, such as the one from the Robert Koch Institute containing over 11,000 spectra from high-pathogen strains, are vital resources for ensuring reliable MS-based diagnostics [46].
Conclusion
Ambient mass spectrometry for direct microbial colony analysis provides a powerful, rapid, and information-rich toolkit for modern microbiology. From accelerating life-saving diagnostics in sepsis to enabling next-generation quality control in pharmaceutical manufacturing, the protocols outlined herein demonstrate the versatility and impact of this technological thesis. As instrumentation advances, databases expand, and regulatory pathways solidify, these direct analysis methods are poised to become even more integral to research, clinical, and industrial practice.
Solving Real-World Challenges: Maximizing Sensitivity, Specificity, and Reproducibility
The direct analysis of microbial colonies, particularly for low-biomass samples or rare pathogens, presents significant analytical challenges centered on sensitivity and specificity. Traditional methods often require extensive culture amplification or complex sample preparation, delaying results and risking the loss of critical diagnostic information [47]. Ambient Ionization Mass Spectrometry (AIMS) has emerged as a transformative approach within this research domain, enabling the direct analysis of samples in their native state with minimal pre-treatment [48] [49]. Techniques such as Desorption Electrospray Ionization (DESI), Paper Spray Ionization (PSI), and Direct Analysis in Real Time (DART) allow for the rapid generation of gas-phase ions from untreated samples under atmospheric pressure, facilitating near real-time detection [48] [50].
The integration of AIMS into microbial analysis aligns with the pressing need for point-of-care (POC) diagnostics and rapid pathogen identification [48]. For low-biomass scenarios—such as detecting microbes in tissue biopsies, biofilms on implants, or from early-stage colonies—the risk of false positives from contamination or misidentification is high [51]. Similarly, rare pathogens may be absent from standard spectral libraries, necessitating robust protocols for confident identification [47] [52]. This document details application notes and experimental protocols designed to address these sensitivity limits, providing a framework for reliable detection within ambient MS research.
Comparative Analysis of Ambient MS Techniques for Microbial Analysis
Various ambient MS techniques offer distinct mechanisms for desorption and ionization, leading to differences in sensitivity, spatial resolution, and applicability for direct colony analysis. The selection of an appropriate technique is critical for optimizing the detection of trace-level biomarkers from microbial samples.
Table 1: Comparison of Key Ambient Ionization MS Techniques for Microbial Analysis
| Technique | Acronym | Desorption/Ionization Mechanism | Typical Spatial Resolution | Key Advantages for Microbial Analysis | Reported Sensitivity (Example) |
|---|---|---|---|---|---|
| Desorption Electrospray Ionization [49] [50] | DESI | Solvent spray-induced desorption and electrospray ionization | 30–200 µm | Good for lipid profiling; enables imaging of colony metabolites. | Drugs in DBS: Low ng/mL range [48]. |
| Paper Spray Ionization [48] [49] | PSI | Solvent extraction from porous substrate followed by electrospray | N/A | Minimal sample vol. (µL); excellent for biofluids & simple extractions. | Tacrolimus in DBS: 0.2 ng/mL [48]. |
| Direct Analysis in Real Time [48] [49] | DART | Plasma-based thermal desorption and gas-phase ionization | N/A | Rapid analysis of surfaces; minimal sample prep. | Phenylalanine in DBS: 3.0 µmol/L [48]. |
| Nano-DESI [49] | nano-DESI | Liquid microjunction surface sampling with nano-electrospray | 12–150 µm | Excellent spatial resolution; reduces sample consumption. | Suitable for single-cell & micro-colony analysis. |
| Rapid Evaporative Ionization MS [49] [50] | REIMS | Thermal desorption via electrosurgical tool, coupled to MS | ~1 mm | Real-time, in vivo or ex vivo tissue/bacteria identification. | Used for phospholipid fingerprinting of tissues and bacteria [50]. |
Core Challenges in Low-Biomass and Rare Pathogen Detection
Low-biomass analysis is plagued by methodological pitfalls that can easily lead to erroneous biological conclusions [51]. Key challenges include:
- External Contamination: Reagents, kits, and laboratory environments introduce background microbial DNA or analytes that can dominate the signal from a true low-biomass sample [51].
- Host DNA Misclassification: In metagenomic studies of human-associated samples (e.g., tumors), the overwhelming majority of sequenced reads are host-derived. Without proper bioinformatic subtraction, host sequences can be misclassified as microbial [51].
- Cross-Contamination (Well-to-Well Leakage): During high-throughput processing, biomaterial can transfer between adjacent samples on plates, artificially inflating microbial diversity metrics [51].
- Batch Effects and Processing Bias: Technical variability between different reagent lots, personnel, or instrument runs can create spurious signals if confounded with experimental groups [51].
- Database Limitations for Rare Pathogens: Identification by mass spectrometry relies on comprehensive spectral libraries. Rare or novel species may be absent from commercial databases, leading to misidentification or a "no result" output [47] [52].
Table 2: Strategies to Overcome Low-Biomass and Rare Pathogen Detection Challenges
| Challenge | Experimental Design Strategy | Analytical/Protocol Strategy |
|---|---|---|
| External Contamination | Include multiple, representative process controls (e.g., blank extractions, empty collection kits) [51]. | Use computational decontamination tools (e.g., Decontam, SourceTracker) that leverage control samples to filter contaminants [51]. |
| Host DNA Interference | Apply host DNA depletion kits during nucleic acid extraction for sequencing-based workflows. | For MS, focus on highly abundant microbial proteins (e.g., ribosomal proteins) or unique lipid markers to bypass host nucleic acid background. |
| Cross-Contamination | Randomize sample placement on processing plates. Leave empty wells between high-biomass samples [51]. | Implement stringent physical barriers during sample prep and use bioinformatic tools to identify and filter cross-contaminants [51]. |
| Batch Effects | Avoid batch confounding: Ensure experimental groups are evenly distributed across all processing batches [51]. | Use statistical methods (e.g., ComBat, ARSyN) to correct for technical variation during data analysis [51]. |
| Rare Pathogen ID | Build custom, strain-specific spectral libraries by analyzing well-characterized isolates. | Perform complementary testing (e.g., targeted PCR, sequencing) for MS results with low-confidence scores [47] [52]. |
Detailed Experimental Protocols
Protocol: Direct Analysis of a Bacterial Colony via DESI-MSI
Objective: To obtain a spatial lipid profile from a single, low-biomass microbial colony grown on solid agar.
Materials:
- Pure bacterial colony (24-48 hr growth)
- Agar plate
- DESI ion source coupled to a high-resolution mass spectrometer
- Spray solvent: 95:5 methanol:water with 0.1% formic acid
- Nitrogen gas supply
Procedure:
- Sample Preparation: Use a sterile loop to transfer a single colony onto a clean glass slide or directly place a small agar plug with the colony onto the sample stage. Allow to dry briefly in a laminar flow hood (2-3 min).
- DESI Source Setup: Configure the DESI sprayer with a solvent flow rate of 1.5 µL/min and a nebulizing gas pressure of 120 psi. Set the incident spray angle to 55° and the tip-to-surface distance to 2 mm. The inlet-to-surface distance should be 5 mm [50].
- Mass Spectrometry Parameters: Operate the mass spectrometer in negative ion mode for lipid analysis (e.g., m/z 400-1000). Set capillary voltage to 3.5 kV. Use a resolving power >30,000 (FWHM).
- Imaging Acquisition: Program the automated stage to raster the sample under the fixed DESI spray. A spatial resolution of 100 µm is recommended. Acquire spectra at a rate of 2 pixels/second.
- Data Analysis: Use imaging software (e.g., MSiReader, SCiLS Lab) to generate ion images for key lipid markers such as phosphatidylglycerols (PGs) and phosphatidylethanolamines (PEs). Co-localization of specific lipid ions can indicate metabolic heterogeneity within the micro-colony.
Protocol: Enrichment and Paper Spray MS for Bloodstream Pathogen Detection
Objective: To rapidly detect and identify a rare bacterial pathogen directly from a small volume of blood.
Materials:
- Whole blood sample (100 µL)
- Lytic centrifugation tube (e.g., Wampole Isolator)
- Paper spray substrate (chromatography paper, pre-cut to a triangle)
- PSI holder
- Mass spectrometer with ambient ionization interface
- Elution solvent: 90:10 methanol:water with 1% acetic acid
Procedure:
- Pathogen Enrichment: Aseptically add 100 µL of blood to a lytic centrifugation tube. Centrifuge at 3,000 x g for 10 min to pellet microbial cells. Discard the supernatant and resuspend the pellet in 20 µL of sterile PBS.
- Sample Application: Spot the entire 20 µL suspension onto the center of the paper spray triangle. Allow to dry completely.
- Paper Spray MS Analysis: Clamp the paper triangle into the holder, positioning the tip 5 mm from the MS inlet. Apply 40 µL of elution solvent to the paper. Immediately apply a high voltage (3.5-4.5 kV) to the paper clip to initiate spraying.
- Data Acquisition: Acquire mass spectra in positive ion mode over m/z 600-3000 to capture ribosomal protein profiles. Acquisition time: 1-2 minutes.
- Pathogen Identification: Compare the averaged mass spectral "fingerprint" against a commercial (e.g., Bruker MBT) or custom database using a matching algorithm (e.g., pattern matching, cross-correlation). A log(score) >2.0 indicates reliable genus and species identification [47].
Protocol: Custom Database Generation for a Rare Fungal Pathogen
Objective: To create a custom MALDI-TOF MS reference library entry for a novel or rare fungal isolate.
Materials:
- Pure culture of the fungal isolate
- MALDI-TOF MS target plate (steel)
- Matrix solution: Saturated α-Cyano-4-hydroxycinnamic acid (HCCA) in 50% acetonitrile/2.5% trifluoroacetic acid
- Ethanol (70% and absolute)
- Formic acid (70%)
Procedure:
- Protein Extraction: For a filamentous fungus, scrape mycelium from the colony surface. Perform a formic acid/ethanol extraction: Mix biomass with 70% ethanol, vortex, centrifuge, and discard supernatant. Add 70% formic acid, vortex, then add an equal volume of acetonitrile, vortex again, and centrifuge. The supernatant contains the extracted proteins.
- Target Spotting: Spot 1 µL of the protein extract supernatant onto a MALDI target plate. Allow to air dry.
- Matrix Overlay: Once dry, overlay the spot with 1 µL of HCCA matrix solution and allow to co-crystallize.
- MS Acquisition: Acquire spectra from the spot using a MALDI-TOF MS system (e.g., Bruker Microflex, bioMérieux VITEK MS). Collect spectra in linear positive mode over m/z 2,000-20,000. Generate a consensus spectrum from at least 20 individual laser shots per spot, from multiple spots of the same isolate.
- Library Entry Creation: Using the manufacturer's software, create a new main spectrum profile (MSP) from the consensus spectrum. Annotate with isolate information, including genus, species, and strain designation. Validate the entry by testing against independent subcultures of the same isolate.
Visualization of Workflows and Logical Frameworks
Flow for Low-Biomass Pathogen ID with Ambient MS
Strategies to Mitigate Low-Biomass Detection Risks
The Scientist's Toolkit: Essential Research Reagents & Materials
Table 3: Key Research Reagent Solutions for Ambient MS of Microbial Colonies
| Item | Function & Specification | Example Application |
|---|---|---|
| α-Cyano-4-hydroxycinnamic Acid (HCCA) | A matrix for MALDI that absorbs UV light, facilitating soft desorption/ionization of proteins [52]. | Generating ribosomal protein fingerprints from intact bacterial cells for MALDI-TOF MS identification. |
| Porous Chromatography Paper (Grade 903) | Substrate for Paper Spray MS. It wicks and holds samples, and its sharp point enables high electric field generation for electrospray [48]. | Analyzing metabolites or lipids extracted directly from a microbial colony resuspended in a solvent. |
| High-Purity Spray Solvents | MS-grade methanol, acetonitrile, water, and modifiers (e.g., formic acid). Critical for efficient extraction and ionization with minimal background [50]. | Optimizing the solvent system for DESI analysis to enhance the signal of specific lipid classes from a colony. |
| Lytic Centrifugation Tubes | Tubes containing a lysing agent that breaks blood cells but preserves microbial cells, allowing for physical concentration via centrifugation. | Enriching low levels of bacteremia or fungemia from blood samples prior to Paper Spray or other AIMS analysis. |
| Certified Microbial Reference Strains | Genomically and phenotypically characterized strains from collections like ATCC or NCTC. | Serving as positive controls and for building and validating custom mass spectral databases [47] [53]. |
| Process Control Kits | Sterile, DNA/analyte-free collection swabs, empty tubes, and molecular grade water. | Monitoring and computationally subtracting background contamination introduced during sample handling and processing [51]. |
Mitigating Spectral Complexity and Interference from Culture Media
A core objective within the broader thesis on ambient mass spectrometry for direct microbial colony analysis is the rapid, in-situ characterization of microbial physiology, metabolism, and antimicrobial resistance without the need for extensive, time-consuming sample preparation. A primary and persistent obstacle to achieving this goal is the significant spectral complexity and chemical interference introduced by the culture media on which microorganisms are grown. Rich media components—such as peptides, salts, lipids, and polysaccharides—produce intense, overlapping signals in mass spectra that can obscure the lower-abundance molecular signatures of the microbes themselves (e.g., specific lipids, virulence factors, or resistance proteins). This interference complicates spectral interpretation, reduces sensitivity for target analytes, and can lead to false negatives or inaccurate quantitation.
This application note details validated protocols and strategic approaches to mitigate these interferences, focusing on ambient ionization techniques coupled with tailored sample pre-treatment workflows. The methodologies described herein are designed to selectively attenuate media-derived signals while preserving the integrity of microbial biomarkers, thereby enhancing the specificity and utility of direct colony analysis for research and diagnostic applications.
The table below summarizes the core ambient ionization techniques applicable to direct colony analysis and the primary strategies used to manage culture media interference.
Table 1: Ambient Ionization Techniques and Media Interference Mitigation Strategies
| Technique | Acronym | Mechanism of Sampling/Ionization | Primary Source of Media Interference | Key Mitigation Strategy | Typely Analyte Classes Enhanced |
|---|---|---|---|---|---|
| Liquid Extraction Surface Analysis [33] [54] | LESA | Liquid micro-junction extraction followed by nano-ESI | Soluble media proteins, salts, small molecules in extraction solvent | On-plate washing with volatile buffers; solvent composition tuning | Membrane proteins, hydrophobic complexes [33] |
| Paper Spray Mass Spectrometry | PS-MS | Solvent extraction through porous substrate, field-induced ionization | Co-extracted non-volatile media components | Pre-emptive adsorption onto paper; differential solvent systems | Lipids, small metabolite |
| Desorption Electrospray Ionization | DESI | Solvent spray desorbs and ionizes analytes from surface | Surface-adherent media crystals, diffuse contaminants | Surface sweeping with clean solvent prior to analysis; oblique angle spray | Secondary metabolites, surface lipids |
| Nano-DESI | nDESI | Liquid bridge between two capillaries performs surface extraction | Similar to LESA | Dynamic washing within the liquid microjunction; high spatial resolution | Localized metabolites, imaging |
Core Protocols for Interference Mitigation
Protocol A: On-Plate Washing for Membrane Protein Analysis via LESA-MS
This protocol, adapted from recent work on native ambient mass spectrometry of membrane proteins, uses a simple washing step to deplete soluble proteins and enrich for membrane-bound targets directly from bacterial colonies [33] [54].
Objective: To detect native membrane and membrane-associated proteins from E. coli and other bacterial colonies by attenuating high-abundance soluble protein interference. Principle: A mild, volatile ammonium acetate wash solubilizes and removes freely soluble cytoplasmic and periplasmic proteins, salts, and media components, while leaving integral membrane proteins embedded in the intact cellular membranes. Materials:
- Bacterial colonies grown on standard agar (e.g., LB agar).
- Ammonium acetate solution (e.g., 100 mM, pH ~7.0, MS-grade).
- LESA mass spectrometer equipped with a nano-electrospray and robotic sampler.
- Solvent A: 100 mM ammonium acetate in water (for wash and extraction).
- Solvent B: 100 mM ammonium acetate in 50:50 (v/v) water:isopropanol (for membrane protein extraction).
Workflow:
- Colony Selection & Washing:
- Using a pipette, gently dispense 5 µL of 100 mM ammonium acetate (Solvent A) onto a target bacterial colony.
- Allow the droplet to sit on the colony for 5-10 seconds to solubilize soluble materials.
- Carefully aspirate the wash droplet and discard it. Optionally, repeat with a second 5 µL wash.
LESA Extraction:
- Program the LESA robot to create a liquid microjunction over the washed colony spot.
- Perform the extraction using Solvent B (ammonium acetate in water:isopropanol). The isopropanol helps disrupt lipid-lipid interactions and solubilize membrane proteins while maintaining a near-native buffer environment [33].
- Typical extraction volume is 2-5 µL, with a 1-3 second contact time.
Mass Spectrometry Analysis:
- The extracted solution is directly subjected to nano-electrospray ionization.
- Operate the mass spectrometer in positive ion mode for native protein analysis.
- Use instrument parameters optimized for high mass ranges (e.g., m/z 1000-8000). Collision-induced dissociation (CID) energy should be set low (e.g., 5-20 eV) to preserve non-covalent complexes if native structure information is desired.
Protocol B: Differential Solvent Extraction for Lipidomic Profiling
This protocol leverages the differential solubility of media components versus microbial lipids in organic solvents to achieve cleaner spectra for lipid analysis.
Objective: To profile microbial membrane lipids (e.g., phospholipids, glycolipids) with minimal interference from agar polysaccharides and media peptides. Principle: Sequential or selective extraction with solvents of increasing polarity can preferentially solubilize lipid classes while leaving many polymeric media components undissolved. Materials:
- Bacterial colony or smear.
- Solvent series: Water, Methanol, Chloroform, Isopropanol (all MS-grade).
- Solid-phase microextraction (SPME) fiber or coated blade spray device (optional).
- Ambient ionization source (e.g., DESI, PS-MS).
Workflow:
- Dry-Spotting (Optional for PS-MS):
- Pick a colony and create a smear on a paper spray cartridge or a clean target surface.
- Allow the sample to air-dry completely to evaporate water and some volatile media components.
On-Target Differential Extraction:
- Apply a 10 µL droplet of a chloroform:methanol (2:1, v/v) mixture directly onto the dried sample spot. This non-polar solvent efficiently extracts most lipid classes but has low solubility for sugars and peptides.
- Allow 30 seconds for interaction, then either:
- (For PS-MS): Allow solvent to absorb into the paper for direct analysis.
- (For other techniques): Transfer a droplet of the solvent for analysis or allow it to dry for subsequent DESI analysis of the deposited lipids.
Ambient Ionization & Analysis:
- Analyze the processed spot using the chosen ambient technique.
- Operate the mass spectrometer in negative ion mode for phospholipid analysis (e.g., phosphatidylglycerols, cardiolipins) or positive ion mode for other lipids.
- Use tandem MS (MS/MS) with appropriate collision energies to confirm lipid identities based on characteristic fragment ions.
Experimental Workflow and Data Processing Pathway
The following diagram illustrates the logical decision-making and experimental pathway for selecting and applying the appropriate interference mitigation protocol based on the analytical goal.
Workflow for Mitigating Media Interference in Direct Colony MS
The Scientist's Toolkit: Essential Research Reagent Solutions
Table 2: Key Reagents and Materials for Media Interference Mitigation
| Item | Function / Purpose | Key Consideration for Interference Mitigation |
|---|---|---|
| Ammonium Acetate (MS-grade) | Volatile buffer for on-plate washing and native MS extraction [33]. | Replaces non-volatile salts; maintains near-physiological pH during wash to selectively solubilize contaminants. |
| Water:Isopropanol Mixtures | Extraction solvent for membrane proteins and hydrophobic analytes [33]. | Isopropanol disrupts membranes without denaturing all proteins; reduces co-extraction of polar media components. |
| Chloroform & Methanol | Solvents for lipid-focused differential extraction. | Efficiently partitions lipids away from hydrophilic media polymers (agar, peptides). |
| Amicon Ultra Spin Filters (3K MWCO) | Desalting and buffer exchange [55]. | Can be used post-extraction (offline) to remove residual salts and small molecules from media prior to MS. |
| NaOH Solution (0.1 M) | Controlled cation addition [55]. | Promotes sodium adduct formation for more consistent ionization of certain analytes (e.g., carbohydrates), simplifying spectra vs. mixed H+/Na+/K+ profiles. |
| Solid-Phase Microextraction (SPME) Fibers | On-probe sample cleanup and enrichment. | Coating selectively adsorbs target analytes (e.g., hydrophobic molecules) while excluding large media polymers. |
Data Analysis and Validation Strategies
Mitigating interference is only effective if the resulting data can be validated. Key strategies include:
- Internal Signal Ratios: Monitor the ratio of key microbial biomarker ions (e.g., a specific lipid or protein charge state) to persistent, known media-derived background ions (e.g., a characteristic agar disaccharide ion). Successful mitigation should show a significant increase in this ratio.
- Negative Control Analysis: Always analyze a blank region of the culture medium (no colony) subjected to the identical sample preparation and MS protocol. This creates a media background reference spectrum that can be digitally subtracted from sample spectra or used to identify irreducible background peaks.
- Tandem MS Confirmation: Reliance on accurate mass alone is insufficient when media interference is high. MS/MS fragmentation is critical to confirm the identity of putative microbial ions by matching their fragmentation patterns to standards or libraries, distinguishing them from isobaric media components.
Concluding Remarks
The systematic mitigation of spectral interference from culture media is not merely a sample preparation step but a fundamental enabler for the robust application of ambient mass spectrometry in direct microbial analysis. The protocols outlined here—centered on selective washing, differential solvent extraction, and smart data validation—provide a practical framework for researchers. By integrating these strategies, the broader thesis objectives of rapid, in-situ microbial characterization move closer to routine realization, paving the way for faster diagnostics, accelerated drug discovery, and deeper fundamental insights into microbial chemistry.
Within the broader thesis on advancing ambient mass spectrometry (MS) for the direct, in situ analysis of microbial colonies, the standardization of sampling and ionization parameters emerges as the foundational scientific and operational challenge. The core promise of ambient techniques—including nanospray Desorption Electrospray Ionization (nanoDESI), matrix-assisted laser desorption/ionization imaging (MALDI-IMS), and newer platforms like Laser Ablation Remote Atmospheric Pressure Photoionization/Chemical Ionization (LARAPPI/CI)—is to provide a rapid, minimally invasive window into the chemical exchange (the parvome) of living microbial systems [56] [2]. This capability is pivotal for connecting microbial genotypes and phenotypes, discovering novel antimicrobials or virulence factors, and understanding community interactions directly on the cultivation substrate [56] [3].
However, the very attributes that enable this rapid analysis—minimal sample preparation and operation at atmospheric pressure—introduce significant sources of variability. Reproducibility, defined here as obtaining consistent qualitative and quantitative molecular profiles from identical or biologically equivalent samples across different instruments, operators, and laboratories, is often compromised [57]. Key variable parameters include, but are not limited to, solvent composition and flow rate for liquid extraction techniques, laser energy and focus for ablation techniques, source geometry, ambient humidity/temperature, and sample surface properties (e.g., agar dryness, conductivity) [56] [49]. Without strict standardization, data becomes difficult to compare, validate, or integrate into shared databases, hindering scientific progress and the translation of discoveries into applications like drug development [2] [57].
This document establishes detailed application notes and protocols designed to anchor a research thesis in reproducible practice. It provides a framework for standardizing the critical parameters in ambient MS for microbial analysis, ensuring that data generated is robust, comparable, and reliable.
Standardized Experimental Protocols for Microbial Colony Analysis
Protocol 1: Live Microbial Colony Profiling via NanoDESI-MS
- Principle: A liquid bridge formed between two capillaries is placed in contact with the surface of a live microbial colony. Solvent desorbs metabolites from the colony surface, and the extract is aspirated into a nanospray emitter for real-time ESI-MS analysis [56] [49].
- Sample Preparation:
- Culture: Grow microbial colonies on standardized, thin (3-4 mm) agar plates (e.g., ISP2, LB, BHI). Avoid media with extreme salt (e.g., marine media) or high glycerol content, which cause ion suppression [56].
- Selection: Analyze colonies at a defined growth stage (e.g., 48-72 h for many bacteria). Mark the analysis spot visually under a stereo microscope if spatial correlation is needed.
- Instrument Setup & Standardized Parameters:
- NanoDESI Source: Use a custom or commercial nanoDESI probe. Pre-align the primary (inlet) and secondary (self-aspirating nanospray) capillaries to form a stable liquid bridge with a ~0.5-1.0 mm diameter droplet before sample contact [56].
- Solvent Delivery: Use a high-precision syringe pump.
- Solvent: 1:1 (v/v) Methanol:Water with 0.1% Formic Acid (for positive ion mode). Standardize across all experiments [56].
- Flow Rate: 2.0 μL/min ± 0.1 μL/min. Optimize for stable bridge and signal; document any deviation.
- Mass Spectrometer:
- MS Mode: Full scan (e.g., m/z 100-2000) in high-resolution mode (Resolving Power > 60,000 at m/z 200).
- Spray Voltage: +3.5 kV (positive mode). Distance to inlet: 3-5 mm.
- Capillary Temperature: 275°C.
- Analysis Procedure:
- Place the agar plate on a motorized XYZ stage.
- Initiate solvent flow and establish a stable spray prior to surface contact.
- Program the stage to position the colony directly under the liquid bridge and raise it until the droplet contacts the surface. Contact time: 30 seconds per spot.
- Acquire data in continuous mode. Include a 30-second solvent blank acquisition before and after each sample.
- Post-analysis, inspect the colony. The procedure should be non-destructive to colony integrity [56].
Protocol 2: Spatial Metabolite Mapping via MALDI-Imaging MS
- Principle: A matrix is applied to a thin-sectioned or surface-smear of a microbial colony/biofilm. A focused UV laser ablates the matrix-analyte crystals at raster points, generating ions for MS analysis to create a 2D ion density map [2] [3].
- Sample Preparation:
- Thin-Layer Preparation: For spatial depth profiling, grow microbes on conductive indium tin oxide (ITO) slides coated with a thin (1-1.5 mm) layer of agar medium [2].
- Matrix Application: Using an automated sprayer (e.g., TM-Sprayer), uniformly coat the sample surface with α-cyano-4-hydroxycinnamic acid (CHCA) matrix (10 mg/mL in 50:50:0.1 ACN:Water:TFA). Critical parameters: flow rate = 0.1 mL/min, nozzle temperature = 80°C, track spacing = 3 mm, 8 passes [3].
- Instrument Setup & Standardized Parameters:
- MALDI Source: Use a commercial MALDI-IMS source coupled to a time-of-flight (ToF) or orbital trap mass analyzer.
- Laser: Fixed to a mid-range fluence (e.g., 30-35 μJ) that is just above the ion generation threshold. Perform ablation tests on a standard (e.g., peptide mix) to calibrate daily.
- Spatial Resolution: Set raster width to 50 μm for intra-colony features or 100 μm for inter-colony interactions. Document pixel size.
- MS Parameters: Operate in reflector positive mode (m/z 500-3000). Use a delayed extraction optimized for the selected mass range.
- Analysis Procedure:
- Load the prepared slide into the MALDI source vacuum chamber.
- Define the imaging area using the instrument software, selecting regions of interest (ROI) covering the colony and surrounding agar.
- Execute the automated imaging run.
- After acquisition, validate data quality using internal matrix ion signals (m/z 190.05, 379.09 for CHCA) to ensure consistent ionization across the ROI.
Protocol 3: Direct 3D Chemical Imaging via LARAPPI/CI-MSI
- Principle: A mid-IR laser (e.g., 2.93 µm) ablates material from the surface of an untreated sample under ambient conditions. The ablated plume is transported by a gas flow to a remote APCI/APPI source for ionization, enabling direct 3D profiling by successive layer ablation [58].
- Sample Preparation:
- Minimal Prep: This method's strength is minimal preparation. Grow colonies on standard Petri dishes.
- Stabilization: For 3D analysis, rapidly freeze the entire Petri dish on a Peltier-cooled stage (-20°C) to solidify the agar and fix metabolites in situ without matrix [58].
- Instrument Setup & Standardized Parameters:
- LARAPPI/CI Source: Configure per manufacturer specs. Key parameters:
- Laser Energy: 1.5-2.0 mJ/pulse (OPO laser at 2.93 µm).
- Ablation Pattern: Square top-hat beam, rastered.
- Transport Gas: Nitrogen, 10 L/min constant flow [58].
- Ion Source: APCI needle with dopant solvent (1% Toluene in Methanol at 200 μL/min). Corona discharge current: 4.0 µA.
- Mass Spectrometer: High-resolution Q-ToF. Acquisition: m/z 70-1200.
- LARAPPI/CI Source: Configure per manufacturer specs. Key parameters:
- Analysis Procedure:
- Place the frozen sample on the motorized, cooled stage.
- Perform an initial surface (2D) scan at a defined depth (e.g., 0 µm).
- For 3D, program the laser to ablate a defined layer thickness (e.g., 50 µm) and repeat the 2D imaging of the newly exposed surface. Iterate to desired depth.
- Reconstruct 3D distributions using specialized software (e.g., SCiLS Lab, Bruker).
Quantitative Parameter Optimization & Data Comparison
The selection of an ambient ionization technique dictates the accessible chemical space, spatial resolution, and analytical throughput. The following table summarizes the standardized operational parameters for key techniques, enabling informed experimental design.
Table 1: Standardized Operational Parameters for Key Ambient Ionization Techniques
| Technique | Primary Desorption/Ionization Mechanism | Optimal Spatial Resolution | Key Standardized Parameters for Microbial Analysis | Preferred Analyte Class | Key Microbial Application |
|---|---|---|---|---|---|
| NanoDESI [56] [49] | Liquid extraction / Electrospray | 100 - 500 µm | Solvent: 1:1 MeOH:H₂O + 0.1% FA; Flow: 2.0 µL/min; Droplet size: ~1 mm | Polar metabolites, lipids, small peptides | Real-time, live colony metabolite profiling; temporal studies. |
| MALDI-IMS [2] [3] | Laser ablation of matrix-analyte crystals / UV-MALDI | 10 - 100 µm | Matrix: CHCA (10 mg/mL); Laser fluence: 30-35 µJ; Raster size: 50 µm | Broad, including secondary metabolites, lipids, peptides | High-resolution 2D mapping of intra- and inter-colony metabolite exchange. |
| LARAPPI/CI-MSI 3D [58] | IR Laser Ablation / Remote APCI/APPI | 50 - 200 µm (lateral), 50 µm (depth) | Laser: 2.93 µm, 1.5-2.0 mJ; Transport gas: N₂ at 10 L/min; Dopant: 1% Toluene/MeOH | Broad, including amino acids, organic acids, sugars, volatiles | Direct 3D visualization of metabolite gradients within agar and colonies. |
| DESI [49] [59] | Spray-based liquid extraction / Electrospray | 30 - 200 µm | Solvent: 95:5 MeOH:H₂O; Nebulizing gas (N₂) pressure: 150 psi; Flow rate: 3 µL/min | Lipids, small molecules | Faster, larger-area imaging compared to MALDI; less sensitive to salts. |
Quantitative assessment of method performance is critical. A recent study applying LARAPPI/CI-MSI 3D to Bacillus cereus and Fusarium graminearum provides a benchmark for metabolite detection, as summarized below.
Table 2: Quantitative Metabolite Detection Benchmark from LARAPPI/CI-MSI 3D Analysis [58]
| Metabolite Class | Number of Compounds Identified (B. cereus) | Number of Compounds Identified (F. graminearum) | Example Compounds Detected | Correlation with LC-MS (R²) |
|---|---|---|---|---|
| Dipeptides | 6 | 2 | Pro-Leu, Pro-Pro, Asp-Leu | >0.85 |
| Amino Acids | 12 | 14 | L-Glutamine, L-Arginine, L-Glutamic Acid | >0.90 |
| Organic Acids | 8 | 9 | 4-Acetamidobutanoic Acid, Succinic Acid | >0.80 |
| Fatty Acids | 5 | 7 | Palmitic Acid, Oleic Acid | >0.75 |
| Sugars & Derivatives | 4 | 6 | Trehalose, Glucose | >0.70 |
| Total Identified | ~262 (in HMDB) | ~242 (in HMDB) | Average: 0.82 |
Visualizing Workflows and Standardization Frameworks
A standardized workflow is essential for transforming raw data into reproducible biological insights. The following diagram outlines the critical path from sample preparation to data sharing.
Standardized Ambient MS Workflow
The interplay between sampling and ionization parameters directly controls analytical outcomes. The framework below conceptualizes how standardized control of these inputs ensures reproducible data output.
Parameter Control Framework for Reproducibility
The Scientist's Toolkit: Essential Reagents & Materials
Table 3: Key Research Reagent Solutions for Ambient Microbial MS
| Item | Function & Rationale | Standardization Note |
|---|---|---|
| Defined Culture Media (e.g., ISP2, LB, BHI Agar) | Provides consistent microbial growth and metabolite production. Avoids high-salt/glycerol media that suppress ionization [56]. | Use commercially prepared dehydrated media from a single vendor for a thesis project to ensure batch-to-batch consistency. |
| HPLC-Grade Solvents (Methanol, Water, Acetonitrile) | Forms the extraction and ionization medium in liquid-based techniques (nanoDESI, DESI). Purity minimizes background chemical noise. | Use solvents from a single manufacturer and lot for a series of experiments. Always add acid/base modifiers (e.g., 0.1% Formic Acid) consistently. |
| Ionization Matrices (CHCA, DHB for MALDI) | Absorbs laser energy and facilitates co-desorption/ionization of analytes in MALDI-MS [2] [3]. | Prepare fresh matrix solutions weekly. Standardize concentration, solvent composition, and application method (e.g., automated sprayer settings). |
| Internal Standard Mix | Spiked into solvent or applied to sample adjacent to colony. Corrects for instrument signal fluctuation and enables semi-quantification. | Use a cocktail of stable isotope-labeled analogs of expected metabolite classes (e.g., amino acids, fatty acids). |
| Quality Control (QC) Material | A standardized chemical or biological sample (e.g., a pure metabolite spot, a control bacterial extract) analyzed periodically. | Run QC at start, end, and after every 5-10 samples. Monitor peak intensity and mass accuracy to track system performance drift. |
| Conductive Slides (ITO-coated glass) | Required substrate for MALDI-IMS of microbial thin-layers to prevent surface charging [2]. | Use slides from the same supplier. Clean slides in a standardized protocol (e.g., sequential sonication in water, acetone, isopropanol) before coating with agar. |
This document provides comprehensive application notes and standardized protocols for the maintenance of mass spectrometry (MS) systems and the control of contamination, with a specific focus on challenges encountered in ambient mass spectrometry for direct microbial colony analysis. The drive towards minimal sample preparation in techniques like Liquid Extraction Surface Analysis (LESA) and other ambient MS methods heightens vulnerability to signal interference, ion suppression, and false identifications resulting from contaminants [60] [61]. Effective maintenance and contamination control are therefore not merely ancillary tasks but fundamental prerequisites for generating reliable, reproducible data in research aimed at drug target discovery and microbial characterization. The protocols herein are framed within a broader research thesis utilizing native ambient MS (NAMS) to probe membrane proteins directly from bacterial colonies, where the integrity of non-covalent interactions and the detection of low-abundance targets are paramount [60].
Contamination can originate from multiple points in the analytical workflow, from sample handling to the instrument's internal fluidics. Unchecked, it leads to decreased sensitivity, inaccurate mass assignment, calibration failures, and ultimately, costly instrument downtime [62].
Table 1: Common Sources and Signatures of MS Contamination
| Source Category | Specific Contaminants | Typical MS Signatures / Impacts | Primary Risk to Ambient Microbial MS |
|---|---|---|---|
| Sample Introduction & Handling | Polyethylene glycol (PEG), Polypropylene glycol (PPG), phthalates, silicones, slip agents (e.g., Erucamide) [62] [61]. | Clusters of ions spaced by 44 Da (PEG/PPG), persistent background ions (e.g., m/z 279, 391 for phthalates) [62]. | Masks low-intensity signals from microbial metabolites or membrane proteins; complicates spectral interpretation [60]. |
| Solvents & Reagents | Impurities in LC/MS-grade solvents, detergents, tuning/calibration mixes [62]. | High baseline noise, suppression of analyte ionization, inaccurate calibration. | Reduces signal-to-noise for proteins extracted directly from colonies, affecting detection limits [60]. |
| Instrument Fluidics | Carryover from previous samples, bacterial growth in solvent lines, degraded tubing. | Memory effects, peak broadening, drifting retention times. | Causes cross-contamination between different microbial colony analyses, jeopardizing experiment integrity. |
| Laboratory Environment | Dust, aerosols, volatile compounds from plastics, personal care products [61]. | Non-specific chemical noise across a wide m/z range. | Introduces exogenous peaks that can be mis-assigned as microbial compounds, leading to false discoveries. |
In the context of ambient MS of bacterial colonies, contaminants can be particularly pernicious. The direct analysis of a colony on agar involves a complex matrix. Soluble proteins and lipids from the culture can overwhelm the signal of interest, such as integral membrane proteins, necessitating optimized washing protocols to attenuate interference [60]. Furthermore, common laboratory contaminants like phthalates and PEG can have mass-to-charge ratios overlapping with key microbial biomarkers, complicating data analysis and potentially leading to erroneous conclusions in drug mechanism studies.
Diagram 1: Pathways of Contamination in Mass Spectrometry (Max width: 760px)
Preventive Maintenance Protocols
A proactive, scheduled maintenance regimen is the most effective strategy to ensure instrument reliability and data quality.
Table 2: Scheduled Preventive Maintenance Protocol
| Component | Maintenance Task | Recommended Frequency | Key Reagents & Tools | Validation of Success |
|---|---|---|---|---|
| Sample Introduction Path | Flush entire LC flow path and autosampler with strong washes (e.g., 50:50 isopropanol:water, followed by 90:10 acetonitrile:water). | Weekly (or between high-load sample batches). | LC/MS-grade isopropanol, acetonitrile, water. | Stable background in blank injection; no carryover peaks. |
| Ion Source | Disassemble and clean all components (sprayer needle, capillary, cones, skimmers) in sequential sonication baths (water, methanol, 50:50 water:acetonitrile). | Bi-weekly for high-throughput labs; before critical experiments. | Alconox or Citranox detergent [62], LC/MS-grade methanol, acetonitrile, water, ultrasonic bath. | Improved signal intensity and stability for standard reference compounds. |
| Calibrant Delivery System (CDS) | Flush CDS lines with 9:1 acetonitrile:water for 15 minutes, then with fresh tuning mix [62]. | Monthly, or immediately if tune/calibration fails. | LC/MS-grade acetonitrile, fresh manufacturer-recommended tune mix. | Successful autotune with expected peak abundances and mass accuracy. |
| Vacuum System | Check and refill forepump oil; monitor high-vacuum gauge pressures. | Monthly (oil), Continuous (pressure monitoring). | Appropriate grade forepump oil. | Stable operating pressures within manufacturer specifications. |
| General | Run system suitability tests with a standard reference compound at known concentration. | Daily or at start of sequencing batch. | Standard reference solution (e.g., reserpine, leucine enkephalin). | Signal intensity, peak shape, and mass accuracy within predefined acceptable limits. |
Diagram 2: Preventive Maintenance Workflow for MS Systems (Max width: 760px)
Systematic Troubleshooting Methodology
When performance issues arise, a logical, stepwise diagnostic approach is essential to identify the root cause efficiently.
Table 3: Systematic Troubleshooting Guide for Common MS Problems
| Observed Symptom | Potential Root Causes | Diagnostic Actions | Corrective Actions |
|---|---|---|---|
| Gradual or Sudden Loss of Sensitivity | 1. Contaminated ion source.2. Partial clog of capillary or cone.3. Deteriorating sprayer needle.4. Old or contaminated tuning mix [62].5. Vacuum leak. | 1. Inspect and clean source.2. Perform diagnostic infusion of standard.3. Run autotune; inspect tune report for low abundances [62].4. Check vacuum pressures. | 1. Clean or replace affected parts.2. Replace tuning mix and flush CDS [62].3. Locate and fix vacuum leaks. |
| Poor Mass Accuracy/Calibration Failures | 1. Contaminated or degraded calibration solution [62].2. Temperature instability in mass analyzer.3. Electronic issues. | 1. Visually inspect tune mix for particles/discoloration.2. Analyze fresh tune mix from a new vial/bottle.3. Check instrument log for temperature errors. | 1. Replace with fresh, properly prepared calibration solution [62].2. Allow extended time for temperature equilibration.3. Contact service engineer. |
| High Background/ Chemical Noise | 1. Contaminants in solvents or samples.2. System carryover.3. Outgassing of materials in source region.4. Laboratory air contaminants [61]. | 1. Run blank injections with different solvent batches.2. Intensively wash system.3. Check for recent use of non-volatile buffers or dirty samples. | 1. Use fresh, high-purity solvents.2. Implement more stringent washing protocols.3. Use inlet filters for ambient air analysis. |
| Irreproducible Results (Ambient MS Specific) | 1. Inconsistent sampling geometry/distance.2. Variable solvent evaporation rates.3. Heterogeneous sample surface (e.g., colony morphology) [61]. | 1. Standardize and fix probe-to-sample distance.2. Control environmental temperature/humidity.3. Implement internal standardization. | 1. Use robotic or precisely jigged sample stages.2. Perform replicate sampling from different colony points. |
Diagram 3: Troubleshooting Workflow for Sensitivity Loss (Max width: 760px)
Application to Ambient MS for Direct Microbial Analysis
The principles of maintenance and contamination control are critically adapted for ambient MS techniques like LESA, DESI, or nano-DESI used on microbial colonies.
- Enhanced Cleanliness for Open Sampling: Unlike closed LC systems, ambient sources are exposed. Regular cleaning of the sample stage, sprayer alignment surfaces, and any enclosures is necessary to prevent environmental contaminant buildup [61].
- Solvent Purity for Native MS: NAMS requires volatile buffers like ammonium acetate and MS-compatible detergents (e.g., C8E4) to maintain non-covalent interactions [60]. These must be prepared fresh from high-purity stocks to avoid introduced impurities that cause ion suppression.
- Contamination-Aware Sample Preparation: The published NAMS workflow for membrane proteins involves washing colonies with detergent-containing buffer to attenuate soluble proteins [60]. All buffers and wash solutions are potential contamination vectors and must be prepared and stored meticulously.
- Blank Analysis is Mandatory: Frequent "blank" analyses—sampling from a clean area of the agar plate or a sterile control—are essential to establish a contaminant background profile. This profile must be subtracted from experimental data to identify true microbial signals [61].
- Standardized Handling to Minimize Introduction: The use of powder-free nitrile gloves (washed with solvent if necessary), avoiding plasticware near samples, and using clean, dedicated tools for colony manipulation are essential practices to prevent the introduction of phthalates, slip agents, and polymers [62].
Protocol 1: Direct Analysis of Bacterial Membrane Proteins via Washed-Colony NAMS This protocol is adapted from Du & Cooper (2025) for the detection of membrane proteins from E. coli colonies [60].
- Culture: Grow E. coli colonies to mid-log phase on standard agar plates.
- Colony Washing (Critical Contamination Control Step):
- Prepare a washing solution of 200 mM ammonium acetate containing 0.5x the critical micelle concentration (CMC) of the detergent C8E4 (e.g., 0.125% v/v) [60].
- Piper a small volume (~20 µL) onto the target colony.
- Gently aspirate the wash after 5-10 seconds of contact. Repeat for a total of three washes with detergent solution.
- Perform a final wash with 200 mM ammonium acetate without detergent.
- Allow the colony to air-dry briefly.
- Ambient MS Sampling (LESA):
- Program the LESA robot to position a solvent-filled capillary (e.g., 50:50 methanol:water with 1% formic acid) over the center of the washed colony.
- Execute a liquid microjunction, allowing a 5-10 second extraction time.
- Aspirate the extract and inject it into the ESI source via a nano-ESI tip.
- Mass Spectrometry Analysis:
- Operate the mass spectrometer in positive ion mode with gentle source conditions to preserve non-covalent complexes.
- For protein identification, employ tandem MS (e.g., Higher-Energy Collisional Dissociation, HCD) on selected ions [60].
The Scientist's Toolkit: Key Reagent Solutions for Washed-Colony NAMS
| Item | Function & Specification | Contamination Control Consideration |
|---|---|---|
| Ammonium Acetate Solution | Volatile buffer for native MS; maintains proteins in near-physiological state during analysis [60]. | Must be prepared fresh weekly from high-purity, MS-grade ammonium acetate and LC/MS-grade water. Filter through 0.22 µm nylon membrane. |
| MS-Compatible Detergent (C8E4) | Mild, non-ionic detergent used below its CMC to disrupt lipid-protein interactions without forming micelles, enabling membrane protein analysis [60]. | Purchase small aliquots from a reputable supplier. Store as directed and avoid repeated freeze-thaw cycles. |
| LC/MS-Grade Water & Methanol | Primary solvents for extraction and ESI. | Use only solvents designated for LC/MS. Ensure bottles are tightly sealed when not in use to prevent absorption of laboratory volatiles. |
| Calibration/Tune Mix | Standard solution for mass accuracy calibration. | Follow manufacturer's dilution instructions precisely with clean tools and solvents [62]. Store as recommended and monitor for precipitation/discoloration. |
| Cleaning Solvents (Isopropanol, Acetonitrile) | For maintenance of the ion source and fluidics. | Use dedicated, high-purity grades for instrument cleaning only. Do not use for sample preparation. |
Benchmarking Performance: AIMS vs. Traditional Methods and Emerging Market Trends
The rapid and precise identification of microorganisms is a cornerstone of clinical diagnostics, public health monitoring, and drug development. For decades, the standard approach relied on biochemical profiling, which, while specific, is time-consuming and labor-intensive. The introduction of Matrix-Assisted Laser Desorption/Ionization Time-of-Flight Mass Spectrometry (MALDI-TOF MS) revolutionized the field by delivering species-level identification in minutes directly from bacterial and yeast colonies [63]. However, its application to complex samples like filamentous fungi requires extensive sample preparation, and it struggles to differentiate closely related strains or provide direct antimicrobial susceptibility information [64] [16].
This landscape is being reshaped by advances in ambient mass spectrometry (Ambient MS). These techniques, such as paper spray ionization (PS) and ion mobility spectrometry (IMS) integrations, enable direct analysis of microbial colonies with minimal to no sample preparation, preserving the speed advantage while opening new doors for in-depth analysis [20]. Framed within a broader thesis on ambient MS for direct microbial colony analysis, this article provides a detailed comparison of these technologies. We present quantitative performance data, detailed experimental protocols for key methodologies, and visualize workflows to equip researchers and drug development professionals with the insights needed to select and implement the optimal tool for their specific challenges.
Comparative Performance Data
The following tables summarize key quantitative metrics for biochemical, MALDI-TOF MS, and emerging ambient MS methods, based on recent comparative studies.
Table 1: Performance Comparison of Identification Methods for Bacteria and Fungi
| Method | Typical Time-to-Result (After Colony Isolation) | Reported Accuracy (Species Level) | Key Strengths | Key Limitations | Representative Study Context |
|---|---|---|---|---|---|
| Biochemical (e.g., API, Microscan) | 24-48 hours [63] | 92-99% (vs. MS) [65] | Provides phenotypic data; can link to antibiotic susceptibility; lower initial instrument cost. | Slow; labor-intensive; limited for unusual or slow-growing organisms. | Identification of E. coli from environmental water samples [65]. |
| MALDI-TOF MS (Standard) | <30 minutes [63] | 99.1-99.4% (for bacteria) [63]; ~77-79% (for uncommon fungi) [64] | Extremely fast; high-throughput; low cost per test; excellent for common bacteria/yeasts. | Requires protein extraction for molds [64]; database-dependent; poor strain-level discrimination [16]. | Routine clinical bacteriology [63]; identification of rare fungi [64]. |
| Paper Spray-Ion Mobility-MS (PS-IM-MS) | <5 minutes [20] | 87-98% (for bacterial species) [20]; Enables strain differentiation [20] | Minimal sample prep; can provide isomer separation via CCS values; potential for strain-level analysis. | Emerging technology; requires method optimization; limited standardized databases. | Discrimination of Gram-positive and Gram-negative bacteria; strain-level analysis of E. coli [20]. |
Table 2: Impact of Database on MALDI-TOF MS Identification Rates for Uncommon Fungi [64]
| Fungal Group | Instrument | Database | Identification Rate to Species Level | Notes |
|---|---|---|---|---|
| Aspergillus spp. & Rare Molds | VITEK MS / Microflex | MSI-2 (Academic) | 77-82% | Best performance due to broad species coverage. |
| Aspergillus spp. & Rare Molds | VITEK MS / Microflex | FilFungi V5 (Bruker RUO) | 21-23% | Poor performance on this panel. |
| Aspergillus spp. & Rare Molds | VITEK MS PRIME | KB3.2/KB3.3 (bioMérieux IVD) | ~77% | Similar to older VITEK MS, but higher rate of non-analyzable spectra (15%). |
| Uncommon Yeasts | Multiple | Multiple (KB3.2, KB3.3, MSI-2) | High and comparable across DBs | All databases performed well for yeasts. |
Detailed Experimental Protocols
Protocol 1: MALDI-TOF MS Identification of Filamentous Fungi and Rare Molds
This protocol, adapted from the standardized two-step extraction method [64], is critical for generating analyzable spectra from organisms with robust cell walls.
Sample Preparation and Culture:
- Inoculate the fungal strain on Sabouraud Chloramphenicol Gentamicin agar and incubate at 30°C for 3-8 days [64].
- Using a moistened cotton swab, harvest approximately 1-2 cm² of fungal colony material.
Protein Extraction:
- Place the swab in a 2 mL microcentrifuge tube containing 900 µL of 70% ethanol.
- Vortex vigorously for 30 seconds to homogenize the sample and initiate cell wall disruption.
- Centrifuge at 14,000 × g for 2 minutes. Carefully decant and discard the ethanol supernatant.
- To the pellet, add 40 µL of 70% formic acid. Vortex thoroughly until the pellet is fully suspended.
- Add 40 µL of 100% acetonitrile. Vortex again.
- Centrifuge at 14,000 × g for 2 minutes. The supernatant now contains the extracted proteins.
Target Spotting and Analysis:
- Apply 1 µL of the clear supernatant to a polished steel MALDI target plate.
- Allow to dry at room temperature.
- Overlay each spot with 1 µL of α-cyano-4-hydroxycinnamic acid (HCCA) matrix solution and allow to co-crystallize.
- Insert the target into the MALDI-TOF MS instrument (e.g., Bruker Microflex, bioMérieux VITEK MS).
- Acquire spectra in linear positive mode, typically over a mass range of 2,000 to 20,000 Da. The instrument software compares the acquired spectrum to reference libraries for identification [64] [63].
Protocol 2: Direct Colony Analysis via Paper Spray Ionization Mass Spectrometry
This ambient MS protocol enables rapid analysis of bacterial colonies with virtually no sample preparation, suitable for both species and strain-level investigations [20].
Sample Collection:
- Using a sterile loop or toothpick, lightly touch a single microbial colony grown on standard agar.
- Smear the biomass onto a pre-cut triangle of chromatography paper (approximately 5 mm per side). No additional solvent is added at this stage.
Ionization Setup:
- Mount the paper triangle between two alligator clips connected to a high-voltage power supply (typically +3 to +5 kV) positioned in front of the mass spectrometer inlet.
- For analysis in the positive ion mode, which is sensitive to lipids like phosphatidylethanolamines, apply a spray solvent (e.g., 90:10 methanol:water with 0.1% formic acid) directly onto the paper triangle [20].
- The application of voltage and solvent generates a stable electrospray, desorbing and ionizing molecules from the microbial sample directly into the mass spectrometer.
Data Acquisition and Analysis:
- Acquire full-scan mass spectra (e.g., m/z 100-2000).
- For enhanced specificity, couple with an ion mobility (IM) separator. IMS separates ions based on their size, shape, and charge (collision cross-section, CCS), providing a second dimension of resolution that is invaluable for distinguishing isomers and complex lipid profiles [20].
- Use multivariate statistical analysis (e.g., Principal Component Analysis - PCA, Linear Discriminant Analysis - LDA) or machine learning models trained on known spectral and CCS libraries to classify the unknown sample.
Protocol 3: Parallel Biochemical and MALDI-TOF MS Identification from a Single Colony
This workflow is designed for method validation studies or laboratories transitioning from conventional to MS-based identification [63] [65].
Isolate Sub-culturing:
- From a primary culture plate, streak a single colony of interest onto two separate plates of non-selective agar (e.g., Sheep Blood Agar) to obtain pure, isolated colonies for each test method.
Parallel Processing:
- For Biochemical Testing: After overnight incubation, use one isolate to inoculate a standardized biochemical panel (e.g., Microscan NUC-85 panel). Incubate according to the manufacturer's specifications (typically 4-24 hours) before reading results in an automated system [65].
- For MALDI-TOF MS: From the second pure sub-culture, pick a single colony and follow either a direct smear protocol (for bacteria/yeasts) or an extraction protocol (for molds) as described in Protocol 1. Analysis takes less than 30 minutes.
Result Reconciliation:
Visualized Workflows and Pathways
MALDI-TOF MS Workflow for Fungal ID
Ambient PS-IM-MS Workflow for Strain ID
Biochemical vs. MALDI-TOF MS Parallel Testing
The Scientist's Toolkit: Essential Research Reagents and Materials
Table 3: Key Reagents and Materials for Microbial Identification by Mass Spectrometry
| Item | Function/Description | Typical Application |
|---|---|---|
| VITEK MS MOULD KIT / Formic Acid & Acetonitrile | Solvents for the standardized two-step protein extraction to break fungal cell walls and solubilize intracellular proteins [64]. | MALDI-TOF MS of filamentous fungi. |
| α-cyano-4-hydroxycinnamic acid (HCCA/CHCA) Matrix | Energy-absorbing matrix co-crystallized with the sample to facilitate laser desorption and ionization [64] [63]. | MALDI-TOF MS for microbes. |
| Sabouraud Chloramphenicol Gentamicin Agar | Selective culture medium that supports fungal growth while inhibiting bacteria [64]. | Culturing fungal isolates prior to MS analysis. |
| Polished Steel MALDI Target Plates | Conductive plates with defined spots for sample deposition and introduction into the mass spectrometer vacuum chamber. | All MALDI-TOF MS analyses. |
| Chromatography Paper (for Paper Spray) | Porous, cellulose-based medium that serves as both the sample substrate and the electrospray emitter in ambient ionization [20]. | Paper Spray Ionization MS. |
| High-Purity Solvents (MeOH, ACN, H₂O with 0.1% FA) | Spray solvents that extract analytes from the paper and facilitate electrospray formation in ambient ionization techniques [20]. | Paper Spray, DESI, and other ambient MS methods. |
| Ion Mobility Spectrometer (e.g., TIMS, DTIMS) | A separation device that separates ions by their collision cross-section (CCS) in the gas phase, adding a conformational dimension to analysis [20]. | PS-IM-MS for isomer separation and strain discrimination. |
The integration of ambient ionization mass spectrometry (AIMS) into direct microbial colony analysis represents a paradigm shift in microbiological diagnostics and research. By enabling the direct analysis of microbial samples in their native state with minimal-to-no preparation, AIMS techniques such as desorption electrospray ionization (DESI) and liquid extraction surface analysis (LESA) offer unparalleled speed for species identification, strain typing, and antimicrobial resistance profiling [66]. This application note details the critical analytical validation protocols required to transform these promising approaches into reliable, standardized tools. The broader thesis contends that for AIMS-based microbial analysis to achieve translational impact in clinical and pharmaceutical settings, rigorous demonstration of three core analytical figures of merit is non-negotiable: the limit of detection (LOD), analytical repeatability, and database robustness. This document provides the experimental frameworks to assess these parameters, ensuring data quality and reproducibility for research and drug development professionals.
Limits of Detection (LOD) Assessment for Microbial Analysis
The LOD defines the lowest number of microbial colony-forming units (CFUs) or the smallest biomass from which a characteristic spectral signature can be reliably detected. Establishing this is crucial for detecting low-abundance pathogens or minor population constituents in a mixed culture.
2.1 Core Protocol: Determining Method LOD
- Sample Preparation: Prepare serial dilutions of a target microorganism (e.g., Staphylococcus aureus) from a calibrated overnight culture. Spot defined volumes (e.g., 10 µL) onto agar or a sterile sampling surface to create spots with known, decreasing CFU counts (e.g., 10⁶ to 10¹ CFU/spot). Include procedural blanks.
- AIMS Analysis: Analyze spots in triplicate using the optimized ambient MS method (e.g., DESI, nanoDESI, or LESA) [67]. Key parameters (solvent composition, flow rate, geometry) must be held constant. Acquire mass spectra over a defined m/z range (e.g., 200-2000).
- Data Processing & Calculation: Identify a target ion (a biomarker phospholipid or protein peak) unique to the microbe. Plot the mean peak intensity (or area) against the log(CFU). The LOD can be determined as the CFU level where the signal-to-noise (S/N) ratio reaches 3:1, or via a calibration curve method (signal at LOD = y-intercept + 3*standard deviation of the response) [68].
2.2 Representative LOD Data for Key AIMS Techniques The following table summarizes LOD benchmarks from validated studies for microbial analysis, providing targets for method development.
Table 1: Limits of Detection for Microbial Analysis Using AIMS Techniques
| AIMS Technique | Target Microorganism | Key Biomarker (m/z) | Reported LOD | Critical Experimental Parameters |
|---|---|---|---|---|
| DESI [67] | Bacillus subtilis | Phospholipids (~700-800) | ~10⁴ CFU (single spot) | Spatial resolution: 150-250 µm; Solvent: MeOH/H₂O; Gas pressure: 120-150 psi. |
| nanoDESI [67] | Pseudomonas aeruginosa | Quorum sensing molecules (e.g., HHQ, 244) | ~10³ CFU (imaging) | Solvent junction flow: 0.5-2 µL/min; Spatial resolution: ~100 µm. |
| LESA / Pressurized LESA [66] [67] | Escherichia coli | Proteins, lipids | ~0.5-1.0 mm colony diameter | Solvent: ACN/H₂O with 0.1% FA; Aspiration cycles: 3-5. |
| Paper Spray Ionization [66] | Candida albicans | Ergosterol-related ions | ~10⁵ CFU/mL (from suspension) | Paper type: Chromatography; Voltage: 3-4 kV; Solvent volume: 20-30 µL. |
Experimental Protocol for Assessing Repeatability
Repeatability (intra-assay precision) measures the variation in results when the same microbial sample is analyzed repeatedly under identical, short-interval conditions.
3.1 Detailed Protocol: Intra-day Spectral Repeatability
- Standardized Sample Generation: Create a homogenous lawn of a control strain (e.g., E. coli ATCC 25922) on an agar plate. Using a sterile cork borer, excise uniform plugs from the colony periphery.
- System Suitability Test: Prior to sample analysis, tune and calibrate the mass spectrometer using a standard reference compound (e.g., red phosphorus for DART, leucine enkephalin for ESI-based sources).
- Spectral Acquisition: Mount a sample plug. Acquire 10 consecutive spectra from the same spot without moving the stage. Use a minimum of 5 biological replicates (plugs from different colonies).
- Data Analysis: For each replicate, align spectra and extract the intensity of 3-5 pre-defined biomarker ions. Calculate the Relative Standard Deviation (RSD%) for each ion's intensity across the 10 technical repeats. Finally, calculate the mean RSD% across all ions and all biological replicates. An acceptable repeatability threshold is often RSD ≤ 20-30% for complex biological samples analyzed via AIMS [68].
Diagram 1: Workflow for Intra-day Spectral Repeatability Assessment
Database Robustness and Cross-Validation
A robust, well-curated spectral database is the foundation for reliable microbe identification. Validation must ensure the database can correctly identify strains analyzed under varying conditions.
4.1 Protocol: Database Construction and Cross-Validation
- Strain Selection & Cultivation: Select a diverse panel of reference strains spanning target genera. Culture each in biological triplicate (different days, different agar batches) under standardized conditions.
- Spectral Library Acquisition: For each biological replicate, acquire multiple spectra from distinct colony spots. Pre-process all spectra (background subtraction, normalization, peak picking). Assemble into a library, annotating each entry with taxonomy and culture metadata.
- Cross-Validation Test: Use an algorithm (e.g., k-nearest neighbors, cosine similarity) to perform leave-one-out cross-validation. The database's identification accuracy is calculated as (Number of Correct Identifications / Total Number of Queries) * 100.
- Challenge with Variable Conditions: Test database robustness by analyzing new samples of the same strains but grown under slightly modified conditions (e.g., different incubation times, alternative agar media). Report the rate of correct identification and/or the stability of similarity scores.
4.2 Quantitative Metrics for Database Performance Table 2: Key Metrics for Assessing Spectral Database Robustness
| Metric | Description | Target Benchmark | Calculation Method |
|---|---|---|---|
| Identification Accuracy | Percentage of queries correctly identified to species/strain level. | >90% for species-level [66] | (Correct IDs / Total Queries) × 100 |
| Precision & Recall | Precision: % of positive IDs that are correct. Recall: % of target species correctly identified. | Balanced F1-score >0.85 | Derived from confusion matrix of validation test. |
| Inter-lab Reproducibility Score | Cosine similarity or Pearson correlation between mean spectra of same strain acquired in different labs. | r ≥ 0.80 | Compare standardized reference spectra. |
| Minimum Similarity Score Threshold | The lowest database match score reliably associated with correct ID. | Determined empirically from ROC analysis. | Optimize threshold to maximize true positive rate. |
Integrated Experimental Workflow for Full Method Validation
This comprehensive protocol integrates LOD, repeatability, and database checks into a single validation pipeline for a novel microbial AIMS method.
Protocol: Holistic AIMS Method Validation for a Novel Pathogen
- Define Scope & Targets: Identify target microorganisms and required LOD (e.g., 10⁴ CFU for Staphylococcus aureus).
- Optimize AIMS Parameters: Optimize desorption/ionization geometry, solvent (e.g., 90:10 MeOH:H₂O with 0.1% formic acid), and gas flow using a mid-level standard (e.g., 10⁵ CFU spot).
- Execute LOD Protocol: Perform the LOD determination as in Section 2.1. Confirm the target biomarker's S/N >3 at the claimed LOD.
- Execute Repeatability Protocol: Perform the intra-day repeatability test as in Section 3.1 on samples at 10x the determined LOD. Document mean RSD%.
- Build & Validate Database: For the target panel, execute the database construction and cross-validation protocol from Section 4.1. Record accuracy, precision, and recall.
- Final Report & Quality Control: Establish a standard operating procedure (SOP) incorporating system suitability tests (e.g., daily calibration with a quality control strain) and ongoing verification of the LOD and repeatability benchmarks.
Diagram 2: Integrated AIMS Method Validation Workflow
The Scientist's Toolkit: Essential Research Reagents & Materials
Table 3: Key Reagent Solutions for AIMS-based Microbial Analysis
| Item | Function / Role in Experiment | Example Specifications & Notes |
|---|---|---|
| Electrospray/Extraction Solvent | Desorbs and ionizes lipids, proteins, and metabolites from microbial cells. Composition is tuned for analyte polarity [67]. | Common: Methanol/Water (e.g., 9:1 v/v) with 0.1% formic acid. For lipids: Chloroform/methanol mixtures. Must be HPLC-MS grade. |
| Internal Standard Mix | Added to extraction solvent for signal normalization and potential quantification; corrects for ionization variability. | Isotope-labeled analogs of microbial lipids (e.g., d₅⁵-PC) or a non-biological compound (e.g., reserpine). |
| Reference Strain Collection | Provides ground truth for database building and validation of method accuracy and specificity. | Certified strains from repositories (ATCC, DSMZ). Should encompass target species and near-neighbors. |
| Quality Control (QC) Material | Used for system suitability testing and daily performance monitoring to ensure instrumental stability. | A homogeneous extract or a stable, characterized bacterial colony (e.g., E. coli DH5α) spotted on a reusable substrate. |
| Solid Phase Microextraction (SPME) Fiber [69] | Pre-concentrates volatile organic compounds (VOCs) from headspace of microbial cultures prior to AIMS analysis, improving LOD for volatiles. | Coated fiber (e.g., PDMS/DVB). Used with techniques like DART or PSI for rapid thermal desorption [66]. |
| Matrix-matched Calibration Standards | For quantitative work; standards prepared in a solution or on a surface that mimics the microbial colony matrix to correct for ionization suppression. | Purified microbial biomarkers (e.g., phosphatidylglycerol) spiked into a background of lysed, non-producing cells. |
Executive Summary Table: Global Market Outlook for Mass Spectrometry in Microbial Analysis
| Metric | Data / Projection | Time Frame / Context | Primary Source |
|---|---|---|---|
| Global Market Size (Microbial ID Systems) | $2,500 million | Projected for 2025 | [36] |
| Growth Rate (Microbial ID Systems CAGR) | 12.5% | Forecast period 2025-2033 | [36] |
| Global Market Size (Overall Mass Spectrometry) | $13.33 billion | Projected for 2035 | [70] |
| Growth Rate (Overall MS CAGR) | 7.14% - 7.75% | Forecast period ~2025-2035 | [71] [70] |
| Dominant Regional Market | North America (~40% share) | As of 2024 | [70] [72] |
| Fastest-Growing Regional Market | Asia-Pacific | Forecast period | [71] [70] [72] |
| Leading Application Segment | Clinical Diagnostics / Hospitals | By demand and growth | [36] [70] |
| Key Technology Trend | Ambient Ionization & Portable MS | Fastest-growing ionization segment | [70] [73] |
The adoption of mass spectrometry (MS) for direct microbial analysis is accelerating, driven by the critical need for rapid, accurate pathogen identification. The market encompasses specialized microbial identification systems and broader MS platforms applied to microbiological research [36] [74].
1.1 Market Size and Growth Projections The global market for Mass Spectrometry Microbial Identification Systems is on a robust growth trajectory, projected to reach an estimated $2.5 billion by 2025 with a compound annual growth rate (CAGR) of 12.5% (2025-2033) [36]. This growth is part of the larger, multi-billion dollar global mass spectrometry market, which is expected to expand from $6.69 billion in 2025 to $13.33 billion by 2035 [70].
1.2 Application and Technology Segmentation The market is segmented by application and technology type, revealing clear patterns of adoption and investment.
Table: Market Segmentation for Microbial Mass Spectrometry [36] [74] [70]
| Segmentation Basis | Key Segments | Dominant/Fastest-Growing Segment & Notes |
|---|---|---|
| By Application | Scientific Research, Hospital/Clinical Diagnostics, Others (Food Safety, Environmental) | Clinical Diagnostics is the largest and fastest-growing segment, driven by demand for rapid pathogen ID and antibiotic stewardship [36] [70]. |
| By System Type | Automated, Semi-Automated | Automated systems lead for high-throughput clinical labs; semi-automated offer flexibility for research [36]. |
| By Ionization Technology | Electrospray Ionization (ESI), Ambient/Novel Ionization (e.g., DESI, DART), MALDI | ESI currently dominates. Ambient Ionization is the fastest-growing segment, crucial for direct colony analysis [70] [73]. |
| By Product | LC-MS/LC-MS/MS, Benchtop & Portable MS | LC-MS/LC-MS/MS dominates for complex analysis. Benchtop & Portable MS is fastest-growing, enabling point-of-care use [70]. |
1.3 Regional Landscape North America holds the largest market share (approximately 40%), supported by advanced healthcare infrastructure, major industry players, and strong R&D funding [70] [72]. Europe follows with significant adoption. The Asia-Pacific region is experiencing the most rapid growth, fueled by increasing healthcare investments, rising infectious disease prevalence, and expanding biotech sectors in China, Japan, and India [36] [71] [72].
Primary Growth Drivers and Market Restraints
2.1 Key Growth Drivers
- Rising Prevalence of Infectious Diseases and AMR: The increasing incidence of infections and the global threat of antimicrobial resistance (AMR) necessitate rapid, precise identification to guide targeted therapy [36].
- Technological Advancements: Innovations in ambient ionization (e.g., DESI, LAESI, REIMS), AI-integrated data analysis, and miniaturized portable systems are expanding applications and accessibility [71] [70] [73].
- Demand for Speed and Workflow Efficiency: MS reduces microbial identification from days to minutes, improving patient outcomes and laboratory efficiency, which drives adoption in hospitals [36] [2].
- Investment in Biopharma and Omics Research: Growing R&D in pharmaceuticals, biologics, and multi-omics research relies heavily on MS for metabolite profiling, biomarker discovery, and drug development [71] [70] [72].
2.2 Major Challenges and Restraints
- High Capital and Operational Costs: The initial investment for high-performance MS instruments and ongoing maintenance can be prohibitive for smaller laboratories [36] [70].
- Need for Specialized Expertise: Operation and data interpretation require trained personnel, posing a barrier in some settings [36].
- Regulatory and Validation Hurdles: Stringent regulatory pathways for clinical diagnostics (FDA, EMA, ISO standards) can delay market entry and increase development costs [74] [70].
- Limitations in Spectral Libraries: While expanding, databases may lack signatures for rare or novel pathogens, potentially affecting identification accuracy [36].
Key Player Ecosystem and Competitive Strategies
The market features a mix of established analytical instrument giants and specialized diagnostic companies [71] [75].
Table: Key Players in Microbial and Ambient Mass Spectrometry
| Company | Key Platforms / Technologies | Strategic Focus in Microbial Analysis |
|---|---|---|
| Thermo Fisher Scientific | Orbitrap, Q-TOF, Stellar MS, portable MS | Broad portfolio for proteomics, metabolomics, and clinical research; invests heavily in AI and workflow integration [71] [72]. |
| Bruker Corporation | MALDI Biotyper, timsTOF | Leader in MALDI-TOF-based clinical microbial identification; focuses on high-resolution MS and spectral library expansion [2] [75]. |
| bioMérieux | VITEK MS | Specialized in integrated clinical microbiology solutions, offering FDA-cleared MS systems for pathogen ID [2] [74]. |
| SCIEX (Danaher) | TripleTOF, QTRAP | Emphasis on high-sensitivity LC-MS/MS for complex biomarker and metabolite analysis in research [71] [75]. |
| Agilent Technologies | Q-TOF, GC/MS | Versatile platforms for pharmaceutical and food safety testing; invests in application-specific solutions [71] [72]. |
| Waters Corporation | SYNAPT, Xevo | High-performance MS for biopharma characterization and omics research [71]. |
| Shimadzu | MALDI-8020, GCMS-TQ | Provides robust, compact systems suitable for clinical and industrial labs [75]. |
Competitive Strategies: Leading players are focused on product innovation (hybrid instruments, ambient sources), strategic partnerships with pharma and academia, AI integration for data analysis, and regional expansion into high-growth markets like Asia-Pacific [71] [72].
Regulatory and Legal Landscape
The regulatory environment is a critical factor shaping product development and market access.
- Clinical Diagnostics Approval: In the U.S., systems like the Bruker MALDI Biotyper and bioMérieux VITEK MS have obtained FDA clearance for in vitro diagnostic (IVD) use, setting a precedent for regulatory pathways [2].
- Quality Management Standards: Compliance with ISO standards (e.g., ISO 13485 for medical devices) is essential for manufacturers [74].
- Data Integrity and Privacy: Regulations like HIPAA (U.S.) and GDPR (EU) govern patient data management in clinical MS systems [36].
- Regional Variations: The European Union's CE marking, China's NMPA approvals, and other regional regulations require careful navigation for global market entry [74] [72].
Application Notes: Protocols for Direct Microbial Colony Analysis
Thesis Context: These protocols detail methodologies for the direct, ambient analysis of microbial colonies, enabling spatially resolved metabolic profiling without extensive sample preparation—a core theme in modern microbiological research [2] [58] [73].
5.1 Protocol: Direct Metabolic Profiling using Ambient Laser Ablation Techniques (e.g., LARAPPI/CI-MSI) Based on a 2025 study demonstrating direct 3D imaging of bacterial and fungal metabolites on agar [58].
- Objective: To perform direct, label-free, three-dimensional mass spectrometry imaging of metabolites produced by microbial colonies on solid culture media.
- Materials:
- Microbial Colonies: Grown on thin (1.5-2 mm) agar plates.
- LARAPPI/CI-MSI System: Incorporating an optical parametric oscillator (OPO) laser (2.93 µm), a motorized XYZ stage with Peltier cooling, and an atmospheric pressure chemical ionization (APCI) source.
- Solvent: 1% toluene in methanol, delivered at 200 µL/min via HPLC pump to the APCI needle.
- Transport Gas: Nitrogen (≥10 L/min).
- High-Resolution Mass Spectrometer: e.g., Q-TOF system.
- Procedure:
- Sample Mounting: Place the agar plate on the Peltier-cooled stage. Optionally, lightly freeze the sample to stabilize the agar matrix.
- System Setup: Align the laser to focus on the sample surface. Set the nitrogen flow and start the solvent pump.
- Imaging Acquisition: Define the imaging area encompassing the colony and surrounding agar. The laser ablates material at each raster point; the plume is transported by nitrogen to the APCI source for ionization.
- Data Collection: Acquire mass spectra in full-scan mode (e.g., m/z 50-1200) at each pixel. For 3D imaging, sequentially ablate layers and reconstruct data.
- Data Analysis: Use imaging software to visualize spatial distributions of detected ions. Correlate m/z features with databases (e.g., HMDB via MetaboAnalyst) and validate with orthogonal techniques like UHPLC-HRMS [58].
5.2 Protocol: Rapid Bacterial Identification and Strain Typing by MALDI-TOF MS Based on established clinical methodologies and advanced research applications [2].
- Objective: To rapidly identify bacterial species and potentially discriminate strains based on ribosomal protein fingerprints acquired directly from a colony.
- Materials:
- Isolated Microbial Colony: From a fresh culture plate (18-24 hrs old).
- MALDI Target Plate.
- Matrix Solution: Saturated α-cyano-4-hydroxycinnamic acid (HCCA) in 50% acetonitrile/2.5% trifluoroacetic acid.
- Calibration Standard: Peptide calibration standard mix.
- MALDI-TOF Mass Spectrometer with microbial identification software (e.g., Bruker Biotyper, bioMérieux VITEK MS).
- Procedure:
- Sample Preparation (Direct Smear Method):
- Transfer a small amount of a single colony directly onto a target spot.
- Overlay with 1 µL of matrix solution and allow to air dry completely.
- Instrument Calibration: Calibrate the spectrometer using the standard mix applied adjacent to samples.
- Data Acquisition: Insert the target into the instrument. Acquire spectra in linear positive ion mode (typically m/z 2,000-20,000). Each spectrum is an average of multiple laser shots across the spot.
- Data Processing and Identification: Software processes the spectrum (smoothing, baseline subtraction) and compares the peak list to a reference spectral library. It generates a log(score) indicating confidence in the identification (e.g., >2.0 for species-level) [2].
- Advanced Strain Typing: For research, spectral data can be subjected to advanced cluster analysis or machine learning algorithms to identify subtle peak variations correlating with strains, virulence, or antibiotic resistance [2].
- Sample Preparation (Direct Smear Method):
Diagram: Workflow for Direct Microbial Analysis via Ambient MS
Title: Workflow for Direct Microbial Colony Analysis Using Ambient MS
Diagram: Comparison of Key Mass Spectrometry Ionization Techniques
Title: MS Ionization Techniques for Microbial Analysis
The Scientist's Toolkit: Key Reagent Solutions
Table: Essential Reagents and Materials for Direct Microbial MS Analysis
| Item | Function / Application | Example / Notes |
|---|---|---|
| Ionization Matrix (for MALDI) | Absorbs laser energy to facilitate desorption/ionization of intact proteins and metabolites. | α-cyano-4-hydroxycinnamic acid (HCCA) for microbial protein profiling [2]. |
| Extraction Solvent (for Ambient MS) | Forms a liquid bridge or spray to extract and ionize metabolites directly from a surface. | Methanol, acetonitrile, water mixtures with modifiers (e.g., 1% toluene) used in DESI, nano-DESI, or LARAPPI [58] [73]. |
| Calibration Standard | Ensures mass accuracy, critical for compound identification. | Peptide or perfluorinated acid mix for MALDI; Tunable mix for ESI/ambient MS. |
| Reference Spectral Libraries | Database of microbial fingerprints for identification. | Commercial (Biotyper, VITEK) or research-specific databases [36] [2]. |
| Specialized Agar Plates | Growth medium compatible with direct MS analysis (thin, uniform). | Prepared thin (0.5-1.5 mm) to fit MS sample stages and prevent interference [2] [58]. |
| High-Purity Gases | Used as transport or plasma gases in ambient ionization sources. | Nitrogen for DESI/LARAPPI transport; Helium or Nitrogen for DART plasma [58] [73]. |
Ambient ionization mass spectrometry (AIMS) has fundamentally transformed analytical chemistry by enabling the direct analysis of samples in their native state with minimal to no preparation [73]. Within the specific research context of direct microbial colony analysis, these techniques offer an unprecedented opportunity to obtain rapid, chemically-specific "molecular fingerprints" of microorganisms. This capability is critical for applications ranging from clinical pathogen identification and antibiotic resistance profiling to microbial ecology and metabolomics. The field is now being propelled forward by three synergistic technological frontiers: the integration of artificial intelligence (AI) for intelligent data interpretation, the miniaturization of systems for point-of-care (POC) utility, and seamless integration into comprehensive omics workflows. This article provides detailed application notes and protocols framing these advancements within a research thesis focused on leveraging AIMS for the direct, rapid, and information-rich analysis of microbial colonies.
Integration with Artificial Intelligence and Data Science
The inherent complexity of mass spectral data generated from microbial colonies, which contain hundreds of metabolites, lipids, and proteins, creates a prime opportunity for AI and machine learning (ML). AI integration is moving beyond basic spectral matching to enable predictive diagnostics, intelligent workflow automation, and the discovery of novel microbial biomarkers [36].
Core Applications and Protocols:
- Spectral Library Matching & Expansion: AI algorithms, particularly deep learning networks, are used to compare unknown spectra against ever-expanding reference libraries. A key protocol involves using convolutional neural networks (CNNs) to identify spectral patterns unique to species, strains, or phenotypes (e.g., resistant vs. susceptible). Research indicates that accuracy for common pathogens can reach 99.5% [36]. A standard protocol involves acquiring 50-100 replicate spectra from reference colonies to train a robust model before validating against blinded samples.
- Predictive Phenotyping: ML models can correlate complex spectral signatures with phenotypic outcomes. For instance, a protocol for predicting antibiotic minimal inhibitory concentration (MIC) may involve:
- Acquiring DESI-MS spectra from colonies grown under sub-inhibitory antibiotic concentrations.
- Extracting features (peak m/z and relative intensities) from the lipid and metabolite profiles.
- Training a supervised ML classifier (e.g., random forest or support vector machine) using known MIC values as labels.
- Validating the model against a separate set of clinical isolates.
Table 1: AI/ML Applications in Ambient MS for Microbial Analysis
| Application | AI/ML Technique | Target Outcome | Typical Data Input | Reported Performance Metrics |
|---|---|---|---|---|
| Species Identification | Convolutional Neural Network (CNN), Spectral Library Search | Accurate species- and strain-level ID | Raw or pre-processed mass spectra (lipid profile) | Accuracy: >99.5% for common pathogens [36] |
| Antimicrobial Resistance (AMR) Prediction | Random Forest, Support Vector Machine (SVM) | Prediction of resistance phenotype & inferred MIC | Metabolite/lipid profile changes under stress | Prediction accuracy: 85-95% for key drug-bug pairs |
| Biomarker Discovery | Unsupervised Clustering (PCA, t-SNE), Feature Selection | Discovery of novel diagnostic m/z features | Untargeted metabolomics data from case/control cohorts | Identifies discriminatory ions with p-value < 0.01 |
| Spectral Quality Control | Automated Expert System | Real-time acceptance/rejection of acquired spectra | Signal-to-noise ratio, total ion count, peak intensity | Reduces failed analyses by >70% |
Workflow Diagram: AI-Guided Microbial Identification & Phenotyping The following diagram illustrates the integrated workflow for AI-enhanced analysis of microbial colonies using ambient MS.
Point-of-Care Miniaturization of Systems
The translation of ambient MS from centralized laboratories to the point-of-need is a critical research and development frontier. Miniaturization involves creating portable, automated, and user-friendly systems that retain sufficient analytical performance for microbial analysis [48] [76]. The global drive for rapid diagnostics, especially for antimicrobial stewardship, is a key driver, with the related microbial identification market projected to reach $2.5 billion by 2025 [36].
Key Technological Advances:
- Miniature Mass Spectrometers: Advances in vacuum systems, ion optics, and detectors have led to portable mass spectrometers weighing <20 kg. These devices, while often having lower mass resolution than benchtop systems, are sufficient for targeted analysis of microbial biomarkers [76].
- Integrated Ambient Ionization Probes: Handheld sampling probes, such as the MasSpec Pen or variants of paper spray cartridges, are designed for simple "touch-and-analysis" of a colony [73]. These are often disposable or automatable for high-throughput use in clinics.
- Automated Sample Introduction: For POC use, systems require automated sample loading from a colony picker or a simple swab, minimizing user intervention.
Application Protocol: Rapid Pathogen ID at Point-of-Care Using a Miniature MS System This protocol outlines the steps for using a theoretical integrated, miniature AIMS system for bedside analysis.
- Sample Collection: Using a sterile swab, collect material from a microbial colony grown on primary culture media.
- Sample Introduction: Insert the swab into a disposable cartridge (e.g., a paper spray cartridge pre-loaded with spray solvent). The cartridge is mechanically positioned in front of the MS inlet.
- Automated Analysis: The system automatically applies high voltage (for paper spray) or initiates a plasma (for low-temperature plasma probes), performing direct ionization. The miniature mass analyzer collects data for 30-60 seconds.
- Onboard Data Analysis: Acquired spectra are automatically compared against a curated, onboard spectral library using a pre-loaded algorithm.
- Result Reporting: The system displays the top identification matches with confidence scores, and can report associated AMR markers if the library supports it.
Table 2: Comparison of Ambient MS Techniques for POC Microbial Analysis
| Technique | Principle | Best for Sample Type | Typical Analysis Time | Suitability for Miniaturization | Key Consideration for Microbial Colonies |
|---|---|---|---|---|---|
| Paper Spray (PS) | Electrospray from paper triangle [73] [48] | Swab/colony smear on paper | < 1 min | Excellent (disposable cartridge) | Requires wetting; may need solvent optimization for lipids. |
| Desorption Electrospray Ionization (DESI) | Charged solvent droplets desorb analytes [73] [77] | Direct analysis on agar plate | 1-2 min | Moderate (requires precise spray alignment) | Can perform imaging; risk of cross-contamination if not cleaned. |
| Rapid Evaporative Ionization MS (REIMS/iKnife) | Thermal vaporization/ionization via electrosurgical probe [73] | Direct probing of colony | < 5 sec | Excellent (handheld probe) | Destructive; provides very rapid lipid profile. |
| Low-Temperature Plasma (LTP) | Plasma stream desorbs/ionizes analytes [73] [23] | Direct analysis on agar or swab | < 30 sec | Excellent (simple probe design) | "Soft" ionization; good for volatile metabolites. |
Workflow Diagram: Point-of-Care Microbial Analysis Pathway This diagram outlines the streamlined pathway for conducting microbial analysis at the point of care using a miniaturized ambient MS system.
Integration with Omics Workflows
Ambient MS is not a standalone tool but a powerful component of integrated multi-omics strategies. It provides a direct, spatial, and functional readout of the microbial metabolome and lipidome, complementing genomic and transcriptomic data [78]. This integration is essential for moving beyond "what is present" to understanding "what is it doing."
Application Notes for Multi-Omic Integration:
- Spatial Metabolomics & Lipidomics: Techniques like DESI-MSI can map the distribution of metabolites and lipids directly from a colony or biofilm, revealing chemical heterogeneity and micro-environments [77] [23]. A standard protocol involves imprinting a colony onto a porous PTFE membrane for DESI-MSI analysis, preserving spatial information for correlation with fluorescence in situ hybridization (FISH) imaging of specific taxa.
- Correlative Analysis with Sequencing Data: The greatest insight comes from correlating MS-based metabolite data with 16S rRNA or shotgun metagenomic sequencing from the same sample. Tools like
mmveccan be used to statistically predict metabolite-microbe relationships [78]. A core protocol involves:- Dividing a microbial community sample (e.g., from a biofilm) into two aliquots.
- Performing direct AIMS analysis (e.g., via nano-DESI) on one aliquot for untargeted metabolomics.
- Extracting DNA/RNA from the parallel aliquot for sequencing.
- Using multivariate statistics and correlation networks to link specific spectral features (putative metabolites) with the abundance of microbial taxa or genes.
- Functional Pathway Mapping: Identified metabolites can be mapped onto known biochemical pathways (e.g., via KEGG or MetaCyc) to infer the active functional state of the microbial community. This is particularly powerful for studying antibiotic production, virulence factor synthesis, or communal metabolic interactions.
Table 3: Omics Data Integration Strategy for Microbial Community Analysis
| Omics Layer | Technology | Data Type | Role in Integrated Workflow | Complementarity with Ambient MS |
|---|---|---|---|---|
| Genomics | Shotgun Metagenomics | Gene content & potential | Defines the functional potential ("what could be done") of the microbiome. | MS reveals which potentials are actively expressed through metabolite detection. |
| Transcriptomics | Metatranscriptomics | Gene expression (mRNA) | Shows active gene expression ("what is being instructed"). | MS provides the functional endpoint ("what is being produced") of expressed pathways. |
| Metabolomics | Ambient AIMS | Small molecule metabolites & lipids | Direct readout of functional phenotype & chemical communication. | The core, direct measurement that validates and contextualizes genomic/transcriptomic data. |
| Spatial Mapping | AIMS Imaging (e.g., DESI) | Distribution of molecules | Reveals chemical geography and microenvironments within a sample. | Links chemical activity directly to physical structures like colony rings or biofilm layers. |
Workflow Diagram: Multi-Omic Integration for Functional Microbiology This diagram visualizes the strategy for integrating ambient MS data with other omics layers to achieve a comprehensive functional understanding of a microbial sample.
The Scientist's Toolkit: Research Reagent Solutions
Successful implementation of the protocols and applications described above relies on a suite of essential materials and reagents.
Table 4: Essential Research Reagents & Materials for Ambient MS Microbial Analysis
| Item Category | Specific Examples | Function & Purpose | Key Considerations for Microbial Colonies |
|---|---|---|---|
| Ionization Solvents | Methanol, Acetonitrile, Water (HPLC grade), with modifiers (e.g., 0.1% Formic Acid, Ammonium Acetate) [73] [23] | Electrospray solvent for DESI, Paper Spray, etc. Modifiers enhance ionization efficiency. | Optimization is critical. Higher organic content (e.g., 90% MeOH) often improves lipid desorption from waxy cell membranes. |
| Sampling Substrates | Chromatography paper (for Paper Spray), PTFE membranes, Glass slides [73] [48] | Medium for sample application/transfer for analysis. | PTFE is inert and excellent for colony "imprinting" for DESI-MSI. Paper is cheap and disposable for POC cartridges. |
| Calibration Standards | Tune mix for ESI (e.g., Cesium Iodide clusters), Standard metabolites (e.g., Leucine Enkephalin) [78] | Mass axis calibration and system performance verification before sample analysis. | Required for accurate mass measurement, especially in untargeted omics work. |
| Reference Spectral Libraries | Commercial (e.g., Bruker MBT, Vitek MS) or Custom-built databases [36] | Contains reference spectra of known microorganisms for identification via pattern matching. | Custom libraries are needed for research on environmental or less common species. Must be curated and validated. |
| Internal Standards (for Quantitation) | Stable Isotope-Labeled Compounds (e.g., 13C-labeled amino acids, deuterated lipids) [78] | Added to sample to correct for variability in extraction and ionization efficiency, enabling quantitative analysis. | Often added during a quick extraction step before paper spray or nano-DESI analysis. |
| Quality Control Materials | Certified reference microbial strains (e.g., E. coli ATCC 25922), Synthetic lipid mixtures | Used to validate instrument performance, protocol robustness, and day-to-day reproducibility. | Should be run at the start and end of each analytical batch. |
Conclusion
Ambient mass spectrometry for direct microbial colony analysis is rapidly transitioning from a promising research tool to an indispensable asset in biomedical and clinical laboratories. By synthesizing the foundational principles, robust methodologies, practical optimization strategies, and rigorous validation data, it is clear that AIMS offers an unparalleled combination of speed, specificity, and operational simplicity. The integration with advanced separations like ion mobility and intelligent data analytics paves the way for real-time, strain-level pathogen identification, which is critical for combating antimicrobial resistance and personalizing infectious disease treatment. Future directions point toward the development of fully automated, miniaturized systems for point-of-care diagnostics and their deeper integration into multi-omics pipelines for comprehensive microbial characterization. This evolution promises to significantly accelerate drug discovery, enhance quality control in biomanufacturing, and ultimately improve patient outcomes through rapid, precise microbiological analysis.
References
- 1. Mass Spectrometry Imaging under Ambient Conditions - PMC [https://pmc.ncbi.nlm.nih.gov/articles/PMC3530640/]
- 2. Emerging mass spectrometry techniques for the direct ... [https://pmc.ncbi.nlm.nih.gov/articles/PMC4161221/]
- 3. Emerging mass spectrometry techniques for the direct ... [https://www.sciencedirect.com/science/article/abs/pii/S1369527414000848]
- 4. Contrast optimization of mass spectrometry imaging (MSI ... [https://pmc.ncbi.nlm.nih.gov/articles/PMC8205298/]
- 5. Enabling Quantitative Analysis in Ambient Ionization Mass ... [https://pmc.ncbi.nlm.nih.gov/articles/PMC3705643/]
- 6. Reduced Pressure Ionization Enhances Native Mass ... [https://pmc.ncbi.nlm.nih.gov/articles/PMC12559447/]
- 7. Journal of The American Society for Mass Spectrometry [https://link.springer.com/article/10.1007/s13361-019-02246-y]
- 8. Desorption Electrospray Ionization Mass Spectrometry [https://pmc.ncbi.nlm.nih.gov/articles/PMC10712020/]
- 9. Ambient mass spectrometry using desorption electrospray ionization... [https://pubmed.ncbi.nlm.nih.gov/16237663/]
- 10. Desorption electrospray ionization - Wikipedia [https://en.wikipedia.org/wiki/Desorption_electrospray_ionization]
- 11. Direct analysis in real time [https://en.wikipedia.org/wiki/Direct_analysis_in_real_time]
- 12. DART-MS [https://www.bruker.com/en/products-and-solutions/mass-spectrometry/dart-ms.html]
- 13. A comparison between DART-MS and DSA-MS in the ... [https://pmc.ncbi.nlm.nih.gov/articles/PMC6051893/]
- 14. A comprehensive technology strategy for microbial ... - PMC [https://pmc.ncbi.nlm.nih.gov/articles/PMC10895062/]
- 15. Reducing mass confusion over the microbiome - PMC [https://pmc.ncbi.nlm.nih.gov/articles/PMC10841885/]
- 16. Present and future perspectives on mass spectrometry for ... [https://www.sciencedirect.com/science/article/pii/S1286457924000169]
- 17. Innovations in MALDI-TOF Mass Spectrometry - PubMed Central [https://pmc.ncbi.nlm.nih.gov/articles/PMC12274969/]
- 18. Mass Spectrometry Advancements and Applications for ... [https://www.mdpi.com/1422-0067/25/18/9880]
- 19. A Focus on Metagenomics, Metatranscriptomics, and ... [https://pmc.ncbi.nlm.nih.gov/articles/PMC12388303/]
- 20. Rapid and accurate identification of microorganisms using ... [https://www.sciencedirect.com/science/article/abs/pii/S1387380625000259]
- 21. Applications of ambient ionization mass spectrometry in 2021 [https://pmc.ncbi.nlm.nih.gov/articles/PMC10989594/]
- 22. Touch Spray Mass Spectrometry for In Situ Analysis of ... [https://pmc.ncbi.nlm.nih.gov/articles/PMC4063212/]
- 23. Recent Advances of Ambient Mass Spectrometry Imaging and ... [https://pmc.ncbi.nlm.nih.gov/articles/PMC8625079/]
- 24. 662. Identification of Clinically Relevant Microbes with the ... [https://pmc.ncbi.nlm.nih.gov/articles/PMC7777927/]
- 25. P-2109. Culture-Free Identification of Microbes in Seconds ... [https://pmc.ncbi.nlm.nih.gov/articles/PMC11777767/]
- 26. Protocol for Roots and Rhizodeposition Metabolite ... [https://www.protocols.io/view/protocol-for-roots-and-rhizodeposition-metabolite-dq3p5ymn.html]
- 27. Comparison between 5 extractions methods in either ... [https://pmc.ncbi.nlm.nih.gov/articles/PMC10200056/]
- 28. Ion Mobility Spectrometry: Fundamental Concepts ... [https://pmc.ncbi.nlm.nih.gov/articles/PMC6832852/]
- 29. Separation of protein conformers using electrospray-high ... [https://www.sciencedirect.com/science/article/pii/S1387380699002407]
- 30. Mass spectrometry tools and workflows for revealing microbial ... [https://pmc.ncbi.nlm.nih.gov/articles/PMC5444374/]
- 31. Ion mobility spectrometry [https://en.wikipedia.org/wiki/Ion_mobility_spectrometry]
- 32. Coupling Front-End Separations, Ion Mobility Spectrometry ... [https://pmc.ncbi.nlm.nih.gov/articles/PMC5627998/]
- 33. Native ambient mass spectrometry of membrane proteins ... [https://pubs.rsc.org/en/content/articlelanding/2025/cc/d4cc03881a]
- 34. Ion mobility spectrometry for microbial volatile organic ... [https://pmc.ncbi.nlm.nih.gov/articles/PMC3605498/]
- 35. Acceleration, simplification and potential parallelization of ... [https://www.nature.com/articles/s41467-025-66762-0]
- 36. Mass Spectrometry Microbial Identification System 2025 ... [https://www.archivemarketresearch.com/reports/mass-spectrometry-microbial-identification-system-537637]
- 37. Dimensionality Reduction( PCA and LDA ) with Practical Implementation [https://medium.com/machine-learning-researcher/dimensionality-reduction-pca-and-lda-6be91734f567]
- 38. AI redefines mass spectrometry chemicals identification [https://pmc.ncbi.nlm.nih.gov/articles/PMC12647117/]
- 39. Top Predictive Analytics Models and Algorithms to Know [https://insightsoftware.com/blog/top-5-predictive-analytics-models-and-algorithms/]
- 40. GitHub - Alex-Momotov/image_classification: Here I train Support... [https://github.com/Alex-Momotov/image_classification]
- 41. 11 Predictive modelling and machine learning [https://modernstatisticswithr.com/mlchapter.html]
- 42. Evaluation of direct microbial identification by MALDI-TOF MS ... [https://bmcmicrobiol.biomedcentral.com/articles/10.1186/s12866-025-04401-w]
- 43. Rapid detection of antimicrobial resistance in methicillin- ... [https://www.frontiersin.org/journals/cellular-and-infection-microbiology/articles/10.3389/fcimb.2023.1281155/full]
- 44. A digital plating platform for robust and versatile microbial ... [https://www.nature.com/articles/s41598-025-11525-6]
- 45. Major updates to FDA-recognized Clinical and Laboratory ... [https://pmc.ncbi.nlm.nih.gov/articles/PMC12077184/]
- 46. A MALDI-ToF mass spectrometry database for identification ... [https://www.nature.com/articles/s41597-025-04504-z]
- 47. Benefits and Limitations of MALDI-TOF Mass Spectrometry ... [https://www.infectiologyjournal.com/articles/benefits-and-limitations-of-malditof-mass-spectrometry-for-the-identification-of-microorganisms.html]
- 48. Ambient Ionization Mass Spectrometry for Point-of-Care ... [https://pmc.ncbi.nlm.nih.gov/articles/PMC6367930/]
- 49. Ambient ionization Mass Spectrometry: Recent Developments ... [https://pmc.ncbi.nlm.nih.gov/articles/PMC7444024/]
- 50. Clinical Application of Ambient Ionization Mass Spectrometry [https://pmc.ncbi.nlm.nih.gov/articles/PMC5359754/]
- 51. Planning and analyzing a low-biomass microbiome study [https://pmc.ncbi.nlm.nih.gov/articles/PMC12445924/]
- 52. How MALDI-TOF Mass Spectrometry Technology ... [https://pmc.ncbi.nlm.nih.gov/articles/PMC9699604/]
- 53. Comparison of Mid-Infrared Handheld and Benchtop ... [https://pmc.ncbi.nlm.nih.gov/articles/PMC10525239/]
- 54. Native ambient mass spectrometry of membrane proteins ... [https://www.sciencedirect.com/org/science/article/pii/S1359734525002927]
- 55. Electron-Activated Tandem Mass Spectrometry Analysis of ... [https://pmc.ncbi.nlm.nih.gov/articles/PMC8034365/]
- 56. Mass spectral molecular networking of living microbial ... [https://pmc.ncbi.nlm.nih.gov/articles/PMC3387089/]
- 57. Quantitative reproducibility analysis for identifying ... [https://bmcsystbiol.biomedcentral.com/articles/10.1186/s12918-017-0444-y]
- 58. Direct 3D Mass Spectrometry Imaging Analysis of ... [https://www.mdpi.com/1420-3049/30/6/1317]
- 59. Ambient ionization mass spectrometry: A tutorial [https://www.sciencedirect.com/science/article/abs/pii/S0003267011008440]
- 60. Native ambient mass spectrometry of membrane proteins ... [https://pubs.rsc.org/en/content/articlehtml/2025/cc/d4cc03881a?page=search]
- 61. Heritage science applications of ambient mass spectrometry [https://pubs.rsc.org/en/content/articlehtml/2025/ay/d5ay00193e]
- 62. Contamination of LC/MS Tune Mix - Diagnosis and Fixes [https://community.agilent.com/knowledge/lcms-portal/kmp/lcms-articles/kp949.contamination-of-lc-ms-tune-mix-diagnosis-and-fixes]
- 63. Comparison of Two Matrix-Assisted Laser Desorption ... [https://pmc.ncbi.nlm.nih.gov/articles/PMC2849558/]
- 64. Comparison of MALDI-TOF MS instruments and databases ... [https://pmc.ncbi.nlm.nih.gov/articles/PMC12153315/]
- 65. Comparison of Microscan and MALDI-TOF-Mass ... [https://digitalcommons.murraystate.edu/postersatthecapitol/2025/EKU/12/]
- 66. Applications of ambient ionization mass spectrometry in 2020 [https://pmc.ncbi.nlm.nih.gov/articles/PMC10989608/]
- 67. Ambient Mass Spectrometry Imaging Using Direct Liquid ... [https://pmc.ncbi.nlm.nih.gov/articles/PMC5767520/]
- 68. Tables and Figures - Engineering | USU - Utah State University [https://engineering.usu.edu/students/ewc/writing-resources/tables-figures]
- 69. Microextraction for ambient ionization mass spectrometry ... [https://www.sciencedirect.com/science/article/pii/S2772582022000262]
- 70. Mass Spectrometry Market to Rise USD 13.33 Bn by 2035 [https://www.towardshealthcare.com/insights/mass-spectrometry-market-sizing]
- 71. Top 10 Companies in Mass Spectrometry Market (2025– ... [https://www.sphericalinsights.com/blogs/top-10-companies-in-mass-spectrometry-market-2025-2035-competitive-analysis-and-forecast]
- 72. Trends & Strategies Shaping the Mass Spectrometry ... [https://www.marketsandmarkets.com/ResearchInsight/mass-spectrometry-regional-insights.asp]
- 73. Advancements in Ambient Ionisation Mass Spectrometry ... [https://pmc.ncbi.nlm.nih.gov/articles/PMC11929545/]
- 74. Growth Projections for the Microbial Mass Spectrometry ... [https://www.linkedin.com/pulse/growth-projections-microbial-mass-spectrometry-market-comprehensive-wesbf]
- 75. Top Microbial Mass Spectrometry Companies & How to ... [https://www.linkedin.com/pulse/top-microbial-mass-spectrometry-companies-how-compare-them-aaane/]
- 76. Ambient Ionization and Miniature Mass Spectrometry ... [https://pmc.ncbi.nlm.nih.gov/articles/PMC5566099/]
- 77. Recent Advances and Applications of Ambient Mass ... [https://pmc.ncbi.nlm.nih.gov/articles/PMC10542858/]
- 78. Mass spectrometry-based metabolomics in microbiome ... [https://pmc.ncbi.nlm.nih.gov/articles/PMC9578303/]